Bearish view
- Sell the BTC/USD pair and set a take-profit at 82,000.
- Add a stop-loss at 90,000.
- Timeline: 1-2 days.
Bullish view
- Set a buy-stop at 87,000 and a take-profit at 90,000.
- Add a stop-loss at 82,000.

The BTC/USD pair remained above the key support at 85,000 as the market reacted to Donald Trump’s Liberation Day speech in which he announced tariffs on more American imports. Bitcoin rose to $86,500, almost 13% from its lowest level this year.
US NFP data ahead
Bitcoin and other risky assets were volatile after Donald Trump held a press conference at the Rose Garden announcing his reciprocal tariffs of most imports to the United States.
Trump hopes that these tariffs will help the country to raise billions of dollars each year. He also hopes that these funds will help to offset his planned tax cuts.
However, analysts worry that these tariffs will hurt the US economy by slowing consumer spending. They will also companies doing business in the US since many of them rely on imports. For example, while Walmart is an American retailer, most of the products in its stores are from other countries.
Bitcoin and the stock market reacted mildly to this tariff news because Trump has been talking about them for weeks. As such, they did not catch the market by surprise, which would have led to more volatility.
Also, Trump had released the most important tariffs weeks before. He unveiled his tariffs on steel and aluminium in February and imported vehicles last week.
The next key catalyst for the BTC/USD pair will be the US nonfarm payrolls (NFP) data on Friday. Economists expect these numbers to show that the US economy added over 140k jobs in March, while the unemployment rate remained at 4.1%. These numbers will influence what the Fed does in the next meetings.
BTC/USD technical analysis
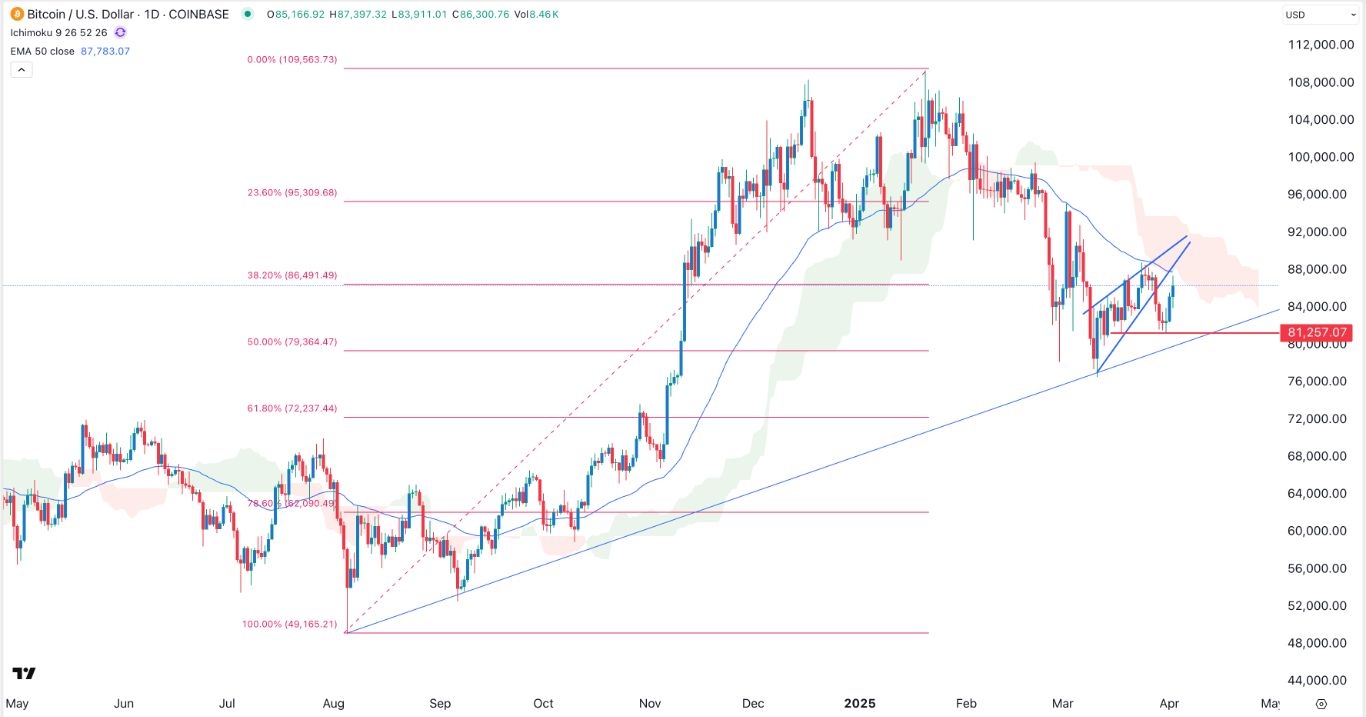
The daily chart shows that the BTC/USD pair has been in a strong uptrend in the past few days. It rose to over 86,000 on Thursday morning, an important level that coincided with the 38.2% Fibonacci Retracement level.
The pair has remained above the ascending trendline that connects the lowest swings in August and September last year, and March 10 this year.
However, the pair remains below the 50-day Exponential Moving Average (EMA) and the Ichimoku cloud indicator. It has also retested the lower side of the rising wedge pattern, a popular bearish sign.
Therefore, the BTC/USD pair will likely resume the downtrend and retest the important support at 81,257, its lowest level on March 31.
Ready to trade our daily Forex signals? Here’s a list of some of the best crypto brokers to check out.
