Bullish view
- Buy the GBP/USD pair and set a take-profit at 1.3100.
- Add a stop-loss at 1.2900.
- Timeline: 1-2 days.
Bearish view
- Sell the GBP/USD pair and set a take-profit at 1.2900.
- Add a stop-loss at 1.3100.

The GBP/USD pair held steady near its highest level this year after the US launched its most significant protectionism policies in over 90 years. It rose to a high of 1.2980, a few points below the year-to-date high of 1.3012. It has jumped by over 7.25% from its lowest level this year.
Trump tariffs and key economic data ahead
The GBP/USD pair continued its uptrend as the world braced for more risks after Trump unveiled his tariffs on imported goods. These tariffs will affect the trade relationship between the UK and the UK.
The UK and US have a goods trade volume of over $148 billion, with the US exporting goods worth over $80 billion and importing goods worth $67 billion. The two countries do more business in services, with the US exporting $80 billion in services and importing $70 billion.
Analysts caution that these policies will negatively impact the two economies and that they will not solve the problems that Trump wants to solve. For example, higher costs of raw materials like steel and aluminum will hurt his goal to make the US a big exporter.
Further, these policies will likely lead to higher inflation and push the Federal Reserve to delay its interest rate cuts. Mohamed El Erian, a popular economist, warned that the Fed may now decide to cut interest rates just once this year.
The next important GBP/USD catalyst will be the upcoming services and composite PMI numbers. Economists expect the UK economic data to show that the composite figure rose to 52, while the services one rose to 53.2. A PMI figure of 50 and above is a sign that a sector is growing.
The GBP/USD pair will also react to the upcoming US PMI and nonfarm payrolls (NFP) data.
GBP/USD technical analysis
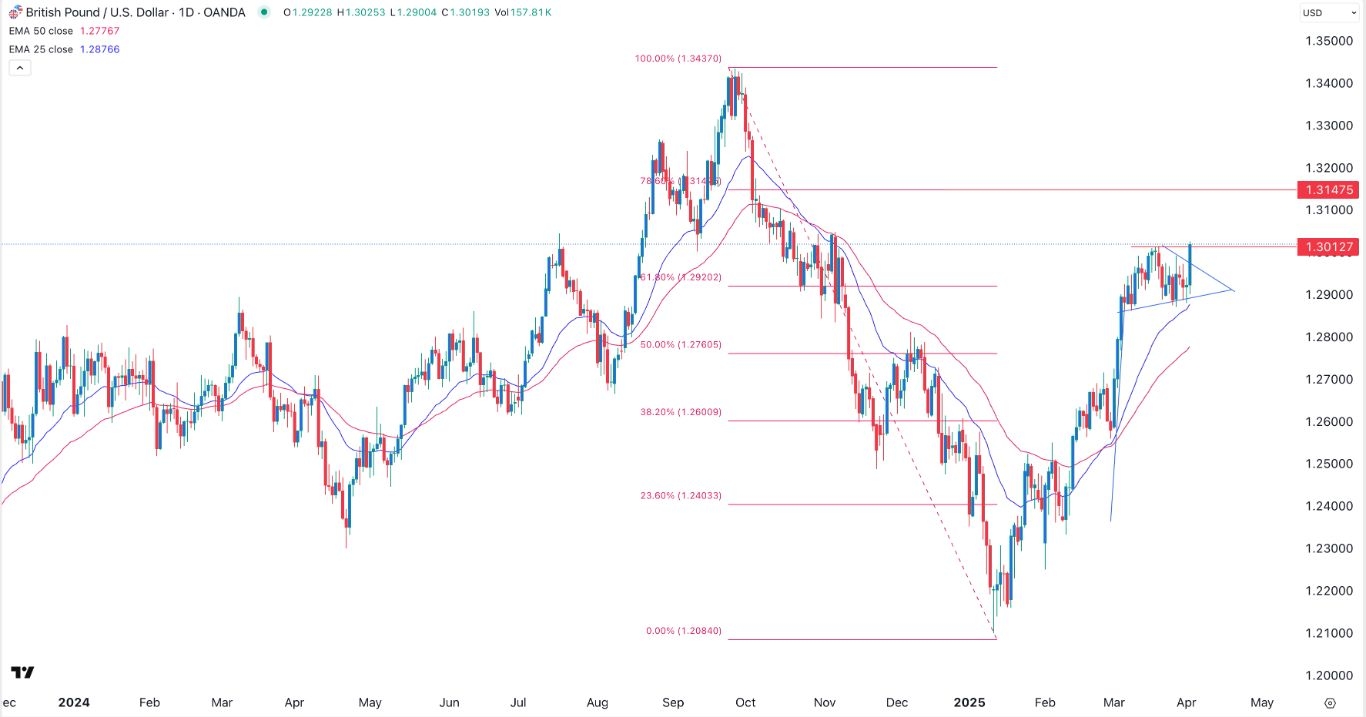
The daily chart shows that the GBP/USD pair continued rising, reaching a high of 1.3012, its highest point since November 6. It moved above the bullish pennant pattern, a popular positive sign.
The pair has moved above the 61.8% Fibonacci Retracement level at 1.2920. It has remained above the 50-day and 25-day moving averages. Therefore, the pair will likely continue rising as bulls target the 78.6% retracement point at 1.3147. A drop below the support at 1.2900 will invalidate the bullish view.
Ready to trade our daily Forex GBP/USD analysis? We’ve made this UK forex brokers list for you to check out
