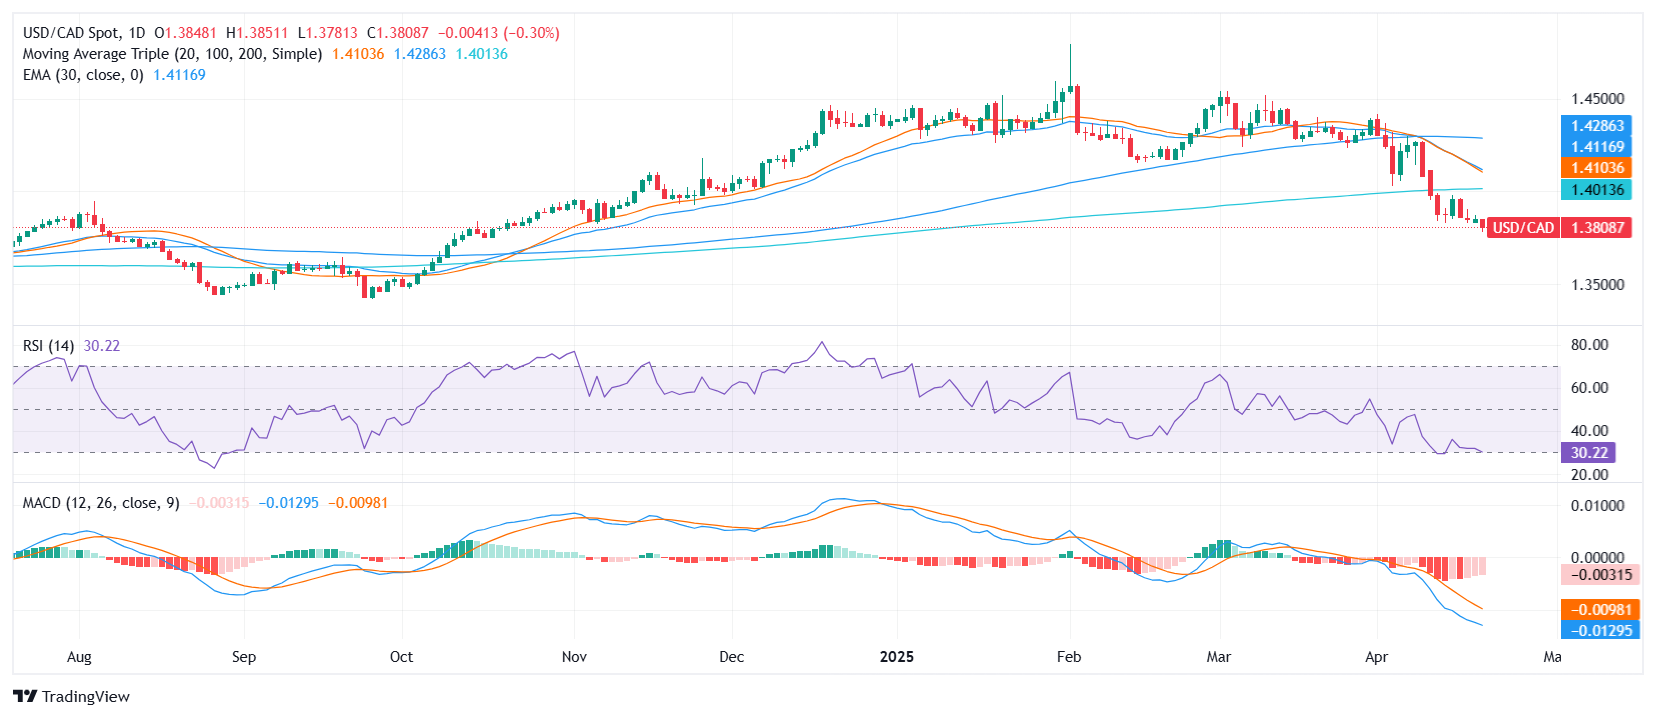
- USD/CAD trades near the 1.3800 area, under pressure after Trump renews criticism of the Fed.
- Political interference concerns and tariff threats weigh heavily on the US Dollar.
- Bearish technical indicators suggest more downside; resistance at 1.3805, 1.3934, and 1.3938.
The USD/CAD pair continues to drift lower on Monday, trading near the 1.3800 level as the US Dollar remains on the defensive following a wave of political headlines. US President Donald Trump sharply criticized Federal Reserve Chair Jerome Powell, accusing him of cutting rates for political reasons in late 2024. The renewed pressure on Fed independence comes just ahead of the central bank’s May policy meeting, with markets firmly expecting no change to the current rate.
Further complicating sentiment, Chicago Fed President Austan Goolsbee noted a rise in short-term inflation expectations, reinforcing the need for caution. Meanwhile, traders are also digesting global headlines tied to US trade policy, as the Trump administration moves forward with tariff discussions and faces pushback from major partners ahead of this week’s G20 meetings in Washington. The broader risk-off mood is favoring the Canadian Dollar, even as crude oil softens.
On the technical front, USD/CAD shows a bearish overall structure. Price action holds within the 1.3781–1.3852 daily range. The Relative Strength Index (RSI) reads 31, suggesting neutral momentum with a bearish tilt as it sits in the oversold threshold. The Moving Average Convergence Divergence (MACD) is flashing a sell signal, echoed by a negative Momentum (10) reading of -0.0444. Although the Awesome Oscillator remains neutral at -0.0346, the weight of the short- and long-term moving averages underscores the downside bias.
Selling pressure is supported by bearish signals from the 10-day EMA at 1.3934 and the 10-day SMA at 1.3938. Broader trend averages also lean bearish, with the 20-day SMA at 1.4103, the 100-day at 1.4278, and the 200-day at 1.4006. Immediate resistance stands at 1.3805, followed by 1.3934 and 1.3938.
Daily chart


