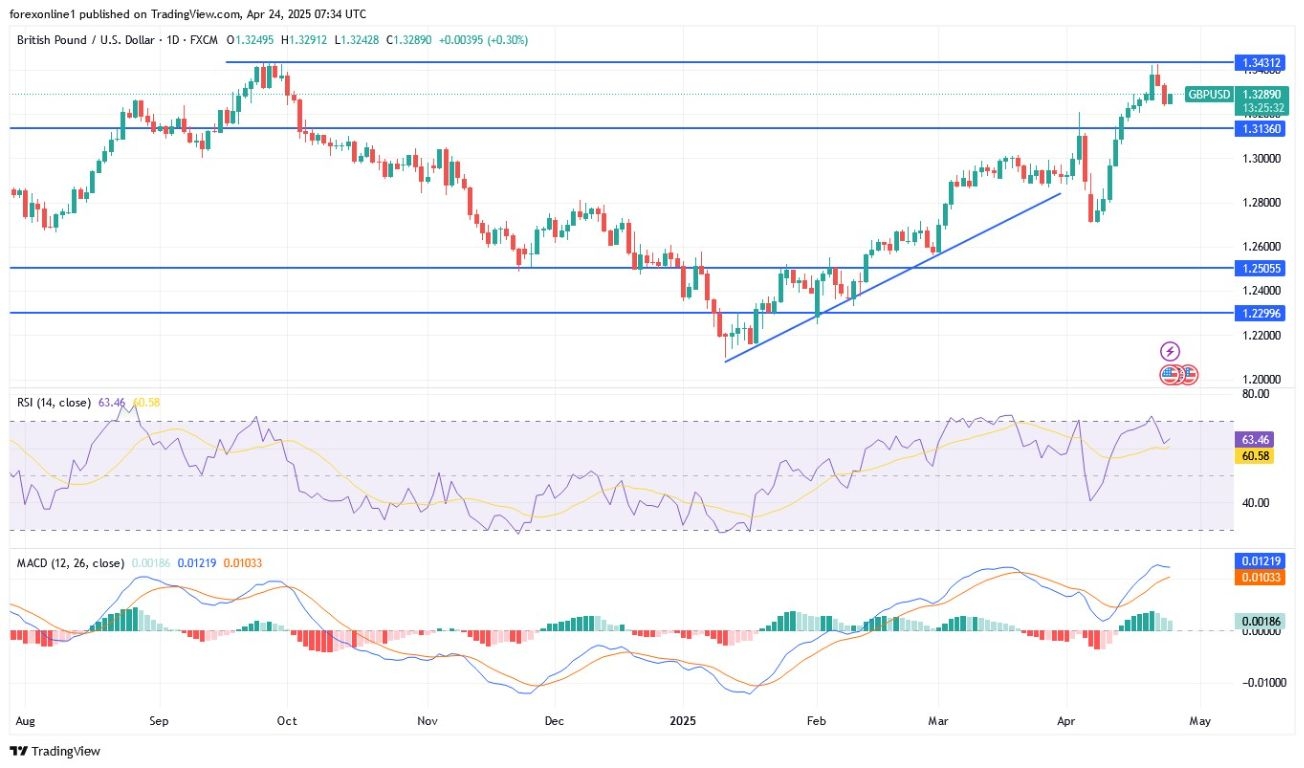
- For two consecutive days, the GBP/USD currency pair has been subject to selling pressure originating from the resistance level of 1.3423, the pair’s highest in six months.
- Losses extending to the support level of 1.3233, around which today’s Thursday trading session is expected to open.
- This comes ahead of a round of US economic releases, led by the announcement of the US weekly jobless claims and US durable goods orders figures, which will be released today, Thursday, at 13:30 Saudi Arabia time.

Sterling Affected by Economic Data Results
According to Forex trading, the British pound declined against most other major currencies following the release of the latest UK services PMI data. The preliminary Purchasing Managers’ Index (PMI) for April revealed a marked decline in the UK’s vital services sector, falling below the 50-point threshold for the first time in 18 months, the dividing line between growth and contraction.
Amid ongoing global disruptions stemming from US President Donald Trump’s tariffs, this month’s services sector data reflected broader economic challenges, leading to decreased demand for the British pound in mid-week trading.
Trading Tips:
The British pound will remain the best performer amid market pressure on the dollar due to Trump’s trade wars, with Britain relatively insulated from the tension.
UK stock prices rebound
According to recent trading and across stock trading platforms, the UK’s FTSE 100 index closed higher by approximately 0.9% at 8,403 points, tracking gains in major stock markets amid trader optimism that trade tensions between the US and China would soon ease. At the same time, concerns about the independence of US monetary policy subsided. Meanwhile, traders monitored the April Manufacturing and Services PMI data, along with major corporate earnings results. The latest data showed UK business activity returning to contraction in April, at its fastest rate in over two years.
According to stock prices, Croda International shares rose by 8.2%, leading the index, after the chemical group reported strong first-quarter sales. On the other hand, Fresnillo shares were among the biggest losers, falling by 5.2%, as the precious metals mining company reported a decrease in silver and gold production in the first quarter despite reaffirming its full-year production outlook.
Technical Analysis for the GBP/USD pair today:
According to recent trading, the GBP/USD pair has recently retreated from its highs near 1.3490, suggesting a potential corrective move within the broader bullish trend. The pair is currently testing key Fibonacci retracement levels that could provide significant support areas for buyers. After reaching overbought conditions, the price has declined towards the 38.2% Fibonacci retracement level at 1.3153, which could offer initial support. Should selling pressure persist, the 50% retracement level at 1.3068 and the 61.8% level at 1.2983 could form the next key support areas. The 61.8% Fibonacci level is particularly important as it coincides with a previous resistance area that could now act as support.
From a broader trend perspective, the GBP/USD pair maintains its bullish structure on the daily timeframe, as evidenced by the series of higher lows and higher highs since March. The 100-day Simple Moving Average (SMA) remains above the 200-day SMA, confirming that the dominant trend is upward.
At the same time, both moving averages are trending upwards, reinforcing the bullish bias. The pair is also trading above an ascending trendline that has supported price action since early March. However, momentum indicators suggest some caution. The Stochastic oscillator is trending downwards from the overbought zone, indicating the potential for continued downward pressure in the near term. Similarly, the Relative Strength Index (RSI) has declined from elevated levels and has room to fall before reaching oversold conditions.
Looking ahead, if the current pullback finds support at any of the aforementioned Fibonacci levels, the GBP/USD pair could resume its bullish trend towards its recent highs and potentially target the 1.3600 area. Conversely, a break below the 61.8% Fibonacci level and the ascending trendline could signal a deeper correction towards the 100% Fibonacci retracement level at 1.2707.
Ready to trade our GBP/USD daily forecast? We’ve shortlisted the best regulated forex brokers UK in the industry for you.
