Bullish view
- Buy the BTC/USD pair and set a take-profit at 99,000.
- Add a stop-loss at 90,000.
- Timeline: 1-2 days.
Bearish view
- Sell the BTC/USD pair and set a take-profit at 90,000.
- Add a stop-loss at 99,000.

The BTC/USD pair has been in a strong uptrend in the past few weeks, reaching its highest level since March. Bitcoin jumped to a crucial resistance level at $96,000 for the first time since February 25. It has soared by over 25% from the lowest level this year.
The BTC/USD pair has rallied as Bitcoin became a safe-haven asset in the past few weeks as it did better than other top assets like stocks as risks rose. Indeed, there are signs that investors have moved to Bitcoin as the spot ETFs recorded over $3 billion in inflows last week.
Bitcoin is also benefiting from the ongoing gold price surge. Gold jumped to a record high of over $3,500 earlier this month as deman for safe havens jumped. Some investors see Bitcoin as a digital version of gold because of its unique characteristics like fixed supply.
The BTC/USD pair has also jumped recently as the US dollar index (DXY) plunged. After soaring to a high of $109 earlier this year, the greenback has dropped sharply in the past few weeks as concerns about its role in the economy rose.
The next important catalyst for Bitcoin will be any important trade-related news. The most likely scenario is where the trade conflict moves into a de-escalation phase, whch is a positive thing for most risky assets.
Bitcoin price will also react to the upcoming earnings dump from the United States. Most companies in the S&P 500 Index like Microsoft, Amazon, Apple, and Berkshire Hathaway will publish their earnings.
The coin will also react to the upcoming US nonfarm payrolls (NFP) data scheduled on Friday. These numbers will provide more information about the economy, and provide the impact of Donald Trump’s tariffs.
BTC/USD technical analysis
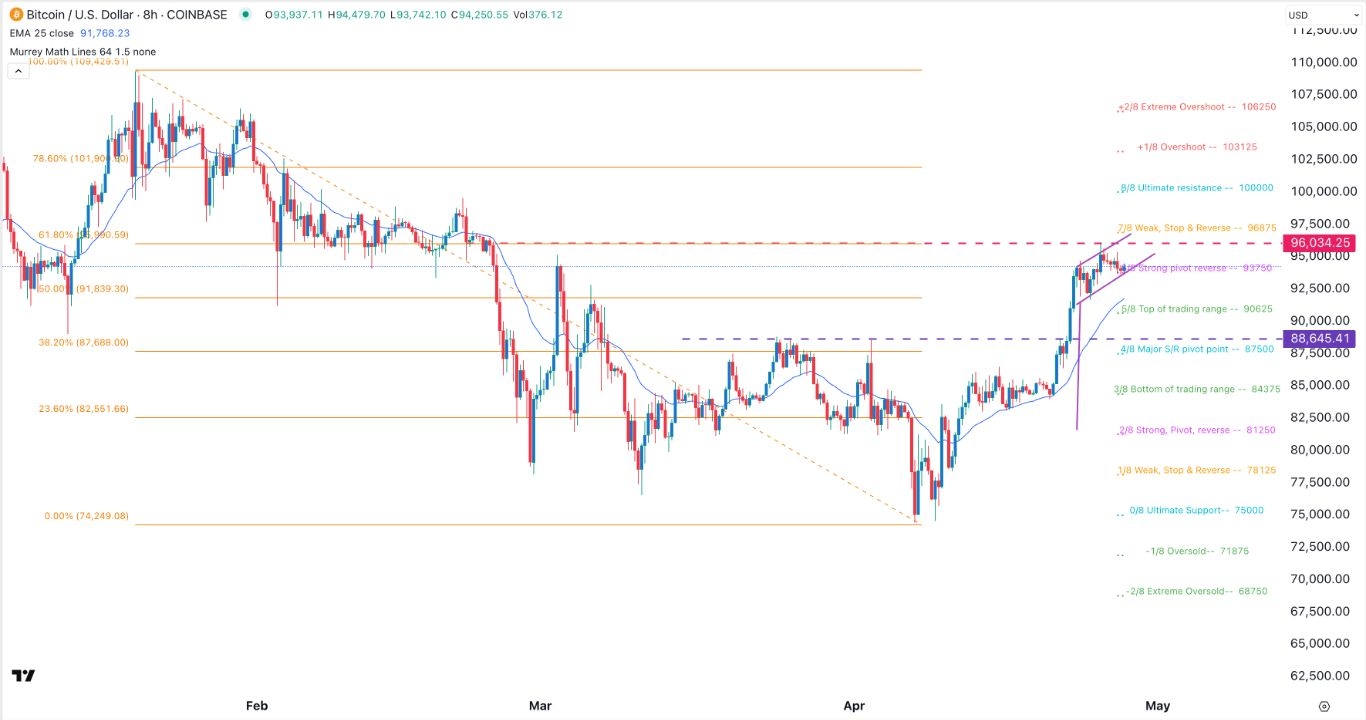
Bitcoin price has bounced back in the past few weeks. It has jumped from a low of 74,250 earlier this month to the current 94,255. On the eight-hour chart, the pair is hovering at the 61.8% Fibonacci Retracement level. It has moved above the 25-period moving average.
The pair has moved to the strong pivot point of the Murrey Math Lines. It has formed a bullish flag pattern. Therefore, it will likely continue rising as bulls target the key resistance level at 99,000. A drop below the support at 94,000 will invalidate the bullish outlook.
Ready to trade our daily Forex signals? Here’s a list of some of the best crypto brokers to check out.
