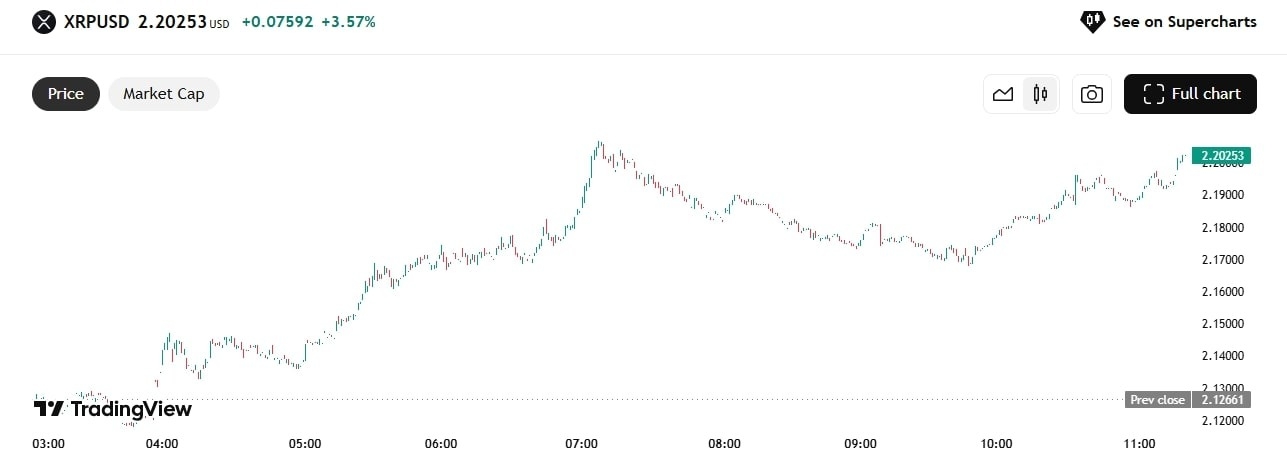
The cryptocurrency Ripple has experienced a 1.3% decline over the past week, which indicates a period of consolidation.
Key Support and Resistance Levels
From a technical standpoint, XRP is currently stabilizing around the $2.14–$2.19 range, with immediate support at $2.00. This level has held up on multiple occasions, forming a local floor that bulls are defending aggressively.

XRP Price | Source:TradingView
Below that, deeper support lies around $1.90, a historically significant level that acted as resistance during XRP’s earlier attempts to breach the $2 threshold.
On the upside, resistance zones remain at $2.36, $2.60, and $3.00.
A daily close above $2.36 would be the first signal that bulls are regaining momentum. $2.60, which aligns with the late-March high, is a psychological and technical hurdle, while $3.00 serves as a major round-number resistance and a symbolic reclaim of 2021-era highs.
Momentum Indicators and Moving Averages
Short-term momentum indicators are sending mixed signals. The Relative Strength Index (RSI) on the daily chart is hovering around 51, suggesting a neutral setup.
It neither confirms overbought conditions nor signals bullish divergence, which is more evidence that the market lacks conviction at current levels.
Meanwhile, moving averages are starting to converge. The 20-day EMA sits just above $2.17, essentially tracking the spot price. The 50-day SMA, slightly lower at $2.08, has acted as a springboard in previous rallies and may do so again if XRP retests this level.
The lack of separation between these averages points to a tightly coiled market, a setup that often precedes explosive movement.
A break above the descending trendline formed from the April 30th high could set the stage for a sharp leg higher. Analysts watching Elliott Wave patterns believe XRP may be in the final stages of forming a bullish diagonal structure. If confirmed, this could indicate the start of a fresh impulse wave targeting $2.60 and beyond.
On-Chain Metrics and Whale Activity
On-chain data adds a layer of caution. Daily active addresses on the XRP Ledger have declined to roughly 30,000, down from over 50,000 earlier in the year.
This suggests diminished network activity and user engagement, a potential warning sign during periods of price stagnation.
Additionally, whale wallets (holding 10 M+ XRP) have been distributing gradually over the past two weeks.
While not a panic signal, it suggests that large holders may be fading recent strength, potentially capping upside unless retail and institutional inflows reaccelerate.
What to Watch: Potential Catalysts and Price Predictions
The next few days are likely to determine XRP’s medium-term direction. If the SEC withdraws its appeal or eases restrictions on Ripple’s institutional dealings, that news alone could serve as the trigger for a breakout.
In such a scenario, XRP could rally swiftly toward $2.60, with an eventual retest of $3.00 not out of the question.
On the technical side, the clearest signal to watch for is a break and daily close above the descending trendline from April 30. That would suggest buyers are back in control and that the current range was simply a base-building exercise.
However, traders should demand volume confirmation on any breakout moves without supporting volume have a high failure rate, especially in a macro-driven token like XRP.
If, instead, XRP fails to hold $2.00, a retest of $1.90 becomes likely. At that point, sentiment could quickly turn bearish, and the diagonal pattern would be invalidated. That could set XRP on a slower, grinding path back toward its long-term moving averages.
Ready to trade our free Forex signals on crypto? Here’s our list of the best MT4 crypto brokers worth checking out.
