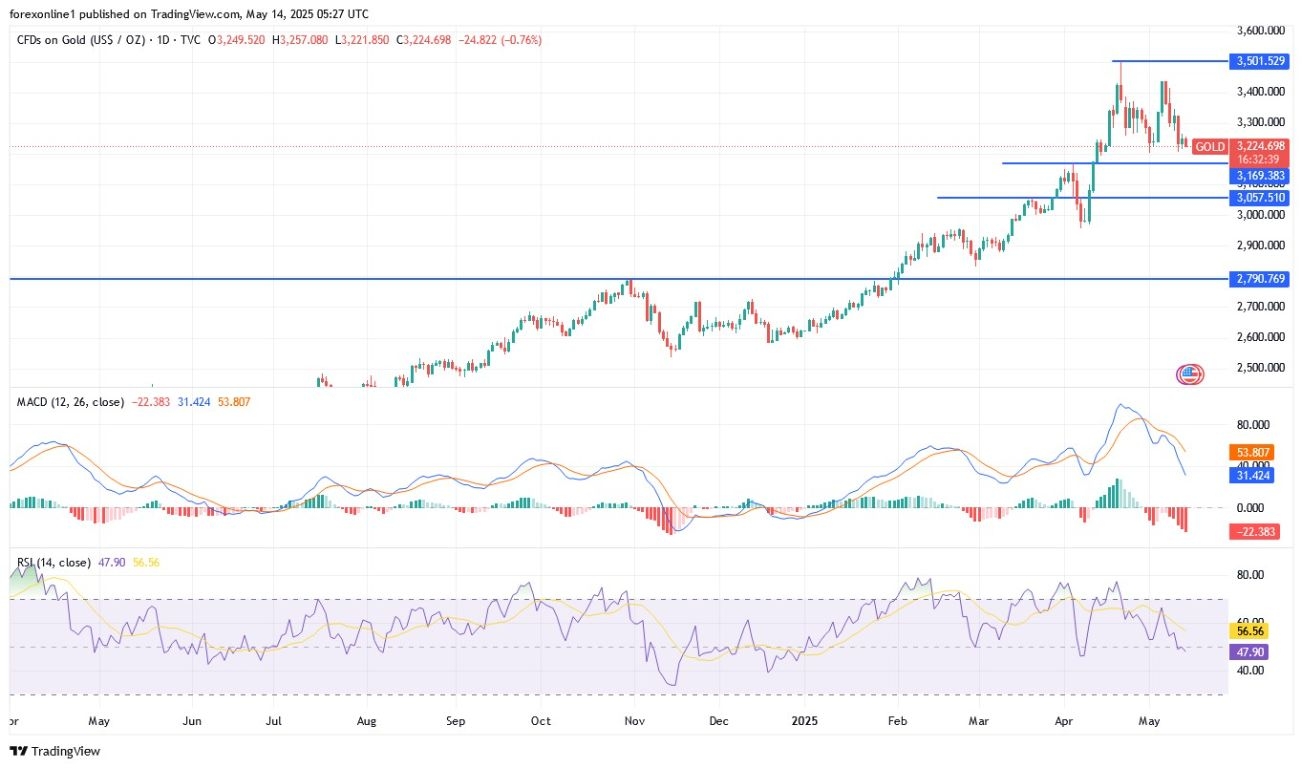
Today’s Gold Analysis Overview:
- Overall Trend for Gold: Bearish.
- Today’s Gold Support Levels: $3200 – $3160 – $3120 per ounce.
- Today’s Gold Resistance Levels: $3270 – $3330 – $3380 per ounce.

Today’s gold trading signals update:
- Sell gold from the resistance level of $3300 with a target of $3140 and a stop-loss at $3370.
- Buy gold from the support level of $3175 with a target of $3300 and a stop-loss at $3130.
Technical Analysis of Gold Price (XAU/USD) Today:
For three consecutive trading sessions, bears have been trying to push the Gold/US Dollar price index XAU/USD to break the $3200 per ounce support level, but they are not finding strong catalysts for this important break, which confirms the strength of the psychological downward level. Spot gold prices are stabilizing around the $3235 per ounce level, with the high for today’s Wednesday session being the $3257 per ounce resistance level.
Amid gold selling, the 14-day Relative Strength Index (RSI) is breaking the midline, giving bears momentum to move, but the index still has more time and space before moving towards the oversold zone. Following the same path, the MACD indicator for the 12.26 closing is moving in a downward trajectory, and the bearish shift in the direction of gold prices will strengthen if the US trade dispute with other global economies is resolved and global trade and geopolitical tensions ease. This is unlikely to happen soon, and therefore gold prices may remain supported, with buying on dips being the best gold trading strategy.
Why Did Gold Prices Decline?
According to trading across gold trading company platforms, selling pressure on gold increased as the continued easing of trade tensions between the United States and China negatively impacted gold’s appeal as a safe haven. Recently, the two countries agreed to temporarily reduce tariffs on each other’s goods for 90 days, which eased concerns about the prolonged impact of the trade conflict.
Trading Tips:
We still advise buying gold from every downward level, but without risk and by distributing the trading amount across several trades at different prices.
Meanwhile, the gold bullion market found some support after the US annual inflation rate fell to 2.3% in April, its lowest level since February 2021 and below the market expectation of 2.4%. Overall, the report supports non-yielding metals, as it gives the Federal Reserve more room to proceed with potential US interest rate cuts. Elsewhere, gold-backed exchange-traded funds (ETFs) recorded net inflows of 115 tons in April, the fifth consecutive monthly increase and the largest in over three years, driven mainly by around 65 tons from China, according to the World Gold Council.
Ready to trade our Gold price forecast? We’ve made a list of the best Gold trading platforms worth trading with.
