Bullish view
- Buy the BTC/USD pair and set a take-profit at 108,250.
- Add a stop-loss at 100,000.
- Timeline:1-2 days.
Bearish view
- Sell the BTC/USD pair and set a take-profit at 100,000.
- Add a stop-loss at 108,250.

The BTC/USD pair has remained in a tight range this week as the market reacted to the trade truce between the United States and China. Bitcoin also reacted mildly to the latest US inflation data, which showed that prices slipped slightly in April. It was trading at $103,300 on Thursday, a few points below this week’s high of 105,790.
BTC/USD Weekly Chart Analysis
The weekly chart shows that the BTC/USD pair has been in an uptrend for a long time. It formed a cup-and-handle pattern at 68,900 between 2012 and late last year. The handle section of this pattern formed between March and November 2024.
This C&H pattern had a depth of about 76%. Therefore, measuring the same distance from the cup’s upper side at $68,900 show that the target is at 122,500.
Most recently, the BTC/USD pair retreated and bottomed at 74,620 in April and then it bounced back to the current 103,440. It is nearing the important resistance level at 108,335.
The pair needs to flip this resistance level to continue the uptrend, potentially to the cup and handle target at 103,440.
Bitcoin Price Daily Chart Analysis
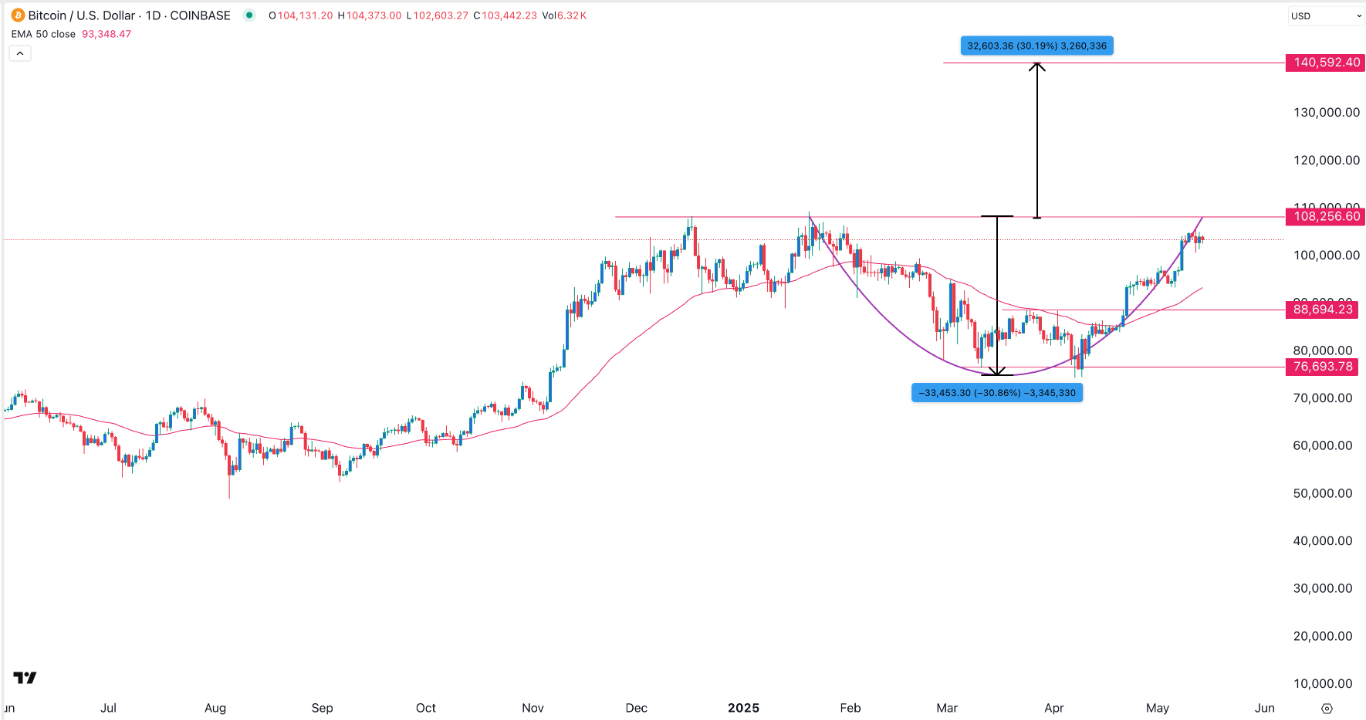
The daily chart shows that Bitcoin dropped and bottomed at $74,640 in April and then bounced back by about 40% to the current $103,420. It formed a double-bottom pattern around the 76,690 level, and then moved above the neckline at $88,695. A double-bottom is one of the most bullish reversal chart patterns in technical analysis.
The pair has also formed another cup-and-handle-like pattern whose upper side is at 108,256. Its depth is about 30%, meaning that the target price is $140,592. This target is derived from measuring the same distance from the cup’s upper side.
The bullish outlook is being supported by the 50-day and 100-day Exponential Moving Averages (EMA), a sign that bulls are in control. More gains will be confirmed if the pair moves above the cup’s upper side. A drop below the support at 100,000 will invalidate the bullish outlook.
Ready to trade our free Forex signals? Here are the best MT4 crypto brokers to choose from.
Crispus Nyaga is a financial analyst, coach, and trader with more than 8 years in the industry. He has worked for leading companies like ATFX, easyMarkets, and OctaFx. Further, he has published widely in platforms like SeekingAlpha, Investing Cube, Capital.com, and Invezz. In his free time, he likes watching golf and spending time with his wife and child.
