Although the price of the pioneer cryptocurrency has since pulled back to approximately $103,000, several fundamental, onchain, and technical metrics suggest that Bitcoin is on course to resume its 2025 bull run.
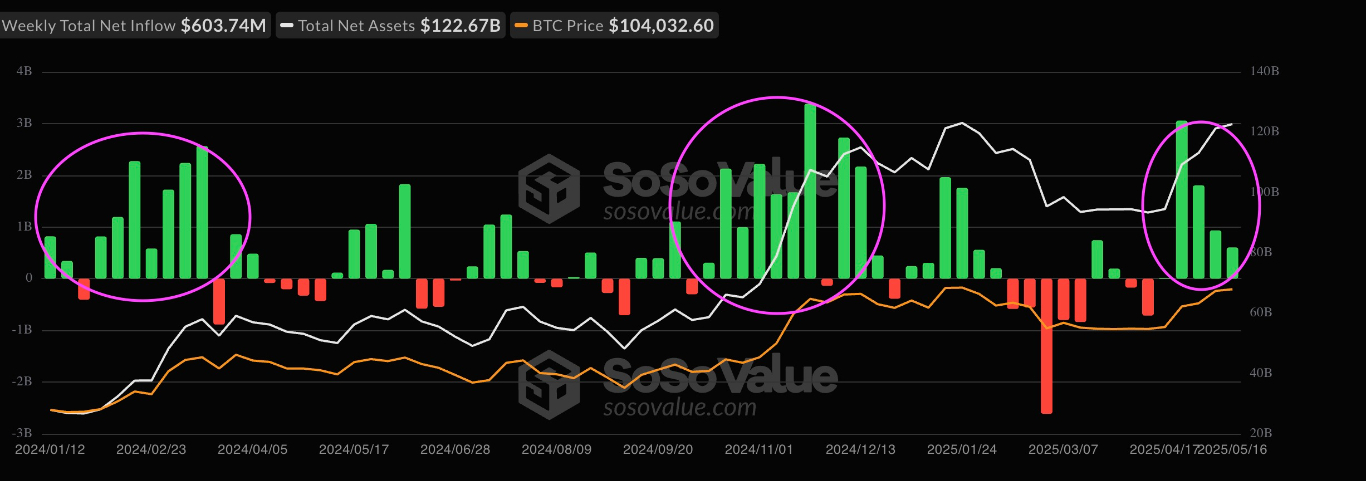
US-based spot Bitcoin ETFs continue to see massive capital inflows, with data from SoSoValue showing that a total of $6.4 billion in net inflows have come into these investment products over the last four weeks.
The chart below shows that after their debut on Jan. 11, 2024, spot Bitcoin ETFs recorded net inflows for seven straight weeks, totalling $11.4 billion, between early February 2024 and mid-March 2024. This preceded a 73% rally in BTC price over the same period to its previous all-time highs of $73,800 reached on March 14, 2024.
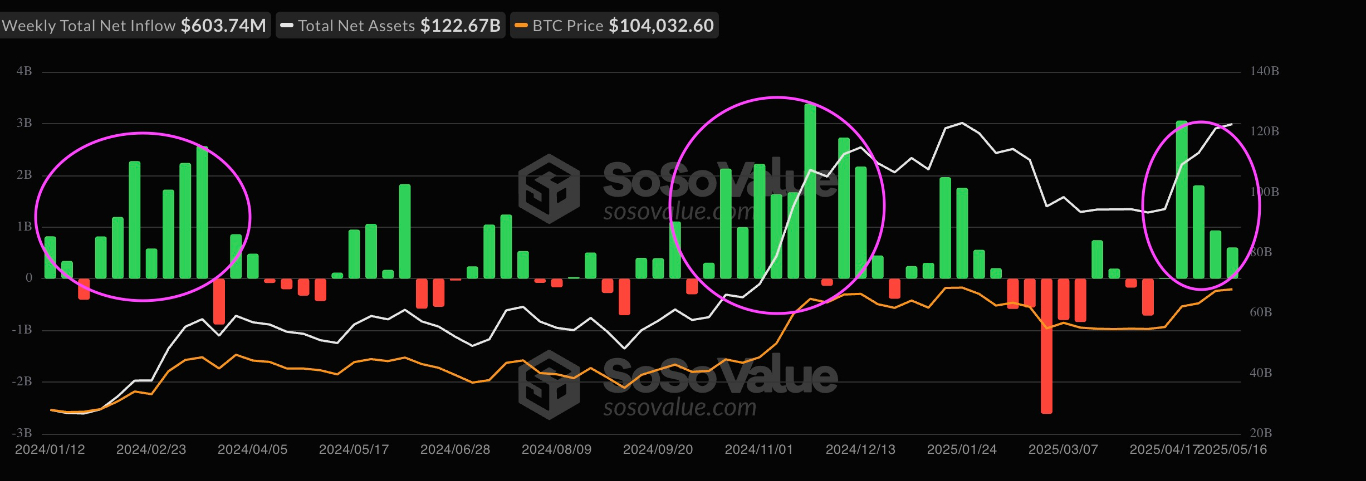 Spot Bitcoin ETF Flows Data. Source: SoSoValue
Similarly, between October 2024 and December, cumulative weekly inflows hit $17.6 billion, aligning with Bitcoin’s 60% rally from $67,000 to $108,000 over the same period.
These cases support the idea that continued inflows into spot Bitcoin ETFs signal strong institutional demand, as investor sentiment increases.
Lately, social media circles have witnessed a revival of positive sentiment. The Bitcoin Fear and Greed Index, a barometer of investor sentiment, stands at a notable score of 74, hinting at prevailing “greed” in the market.
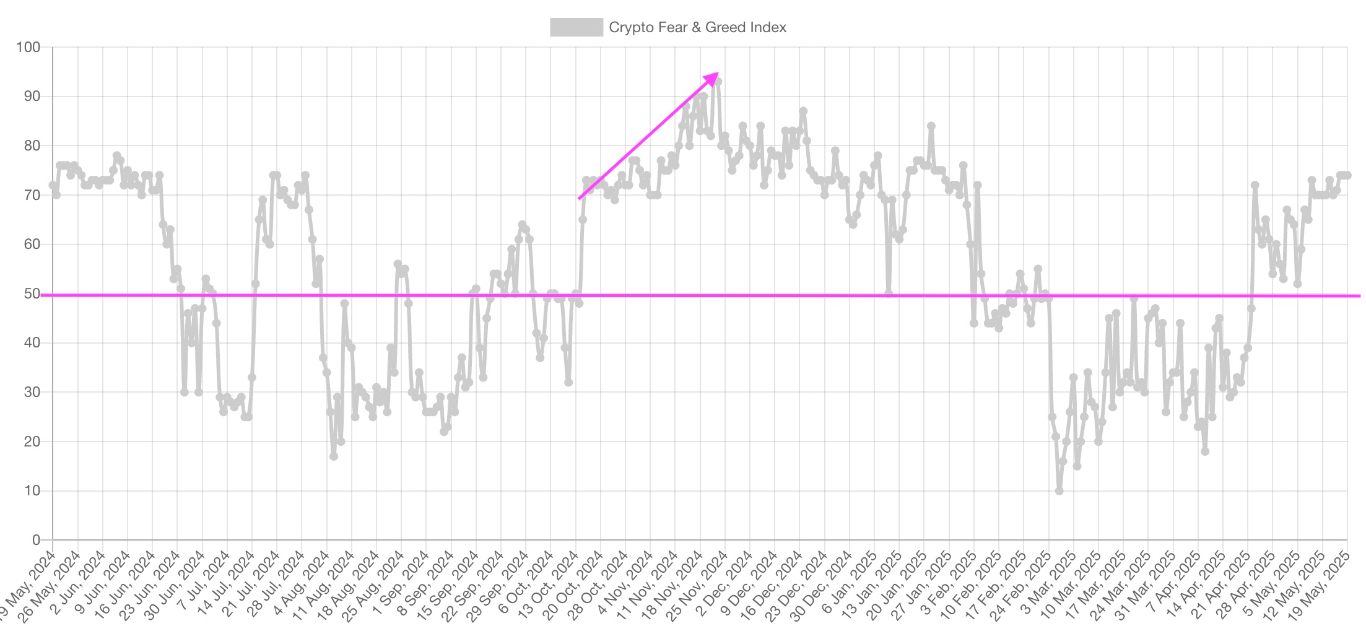 Crypto Fear and Greed Index. Source: Alternative.me
Notably, this index is currently above the 50 level, after staying below the midlevel between February and April. This is a strong indication of the positive sentiment the market players have for the wider crypto market.
This pattern in market sentiment has been a precursor to price rallies in the past and could be an indicator of an upcoming bull run. Interestingly, the last time the market sentiment was at this level of greed was in November 2024, before Bitcoin rallied to its previous all-time high price of $108,000 on Dec. 16, 2024.
If the trend continues, Bitcoin is likely to continue its rally toward new all-time highs.
The recent rise above $107,000 saw more than 97% of all Bitcoin in supply turn into profit, but this has not led to intense profit-taking, according to data from CryptoQuant.
CryptoQuant’s short-term holder (STH) Spent Output Profit Ratio (SOPR) metric reveals that despite STHs returning to profit, they are not aggressively booking profits.
SOPR is a metric used to show whether STHs have made a profit or loss compared to when they first held Bitcoin. A value above 1 indicates a high percentage of coins that have made a profit on their short-term investment, and a value below 1 indicates a high percentage of coins that are in loss.
The chart below reveals that this indicator is currently valued at 1.01%, suggesting that STHs are realizing some profits and are not yet overheating.
A SOPR value of 1.01% was considered overheating during the 2-month sideways price action witnessed since March (when the price was stuck in a range between $80,000 and $98,000), suggesting that there is more room for BTC on the upside before reaching this level.
If the price of Bitcoin surpasses the all-time high and the short-term holder SOPR value continues to spike, BTC could see the start of a full-blown parabolic rally.
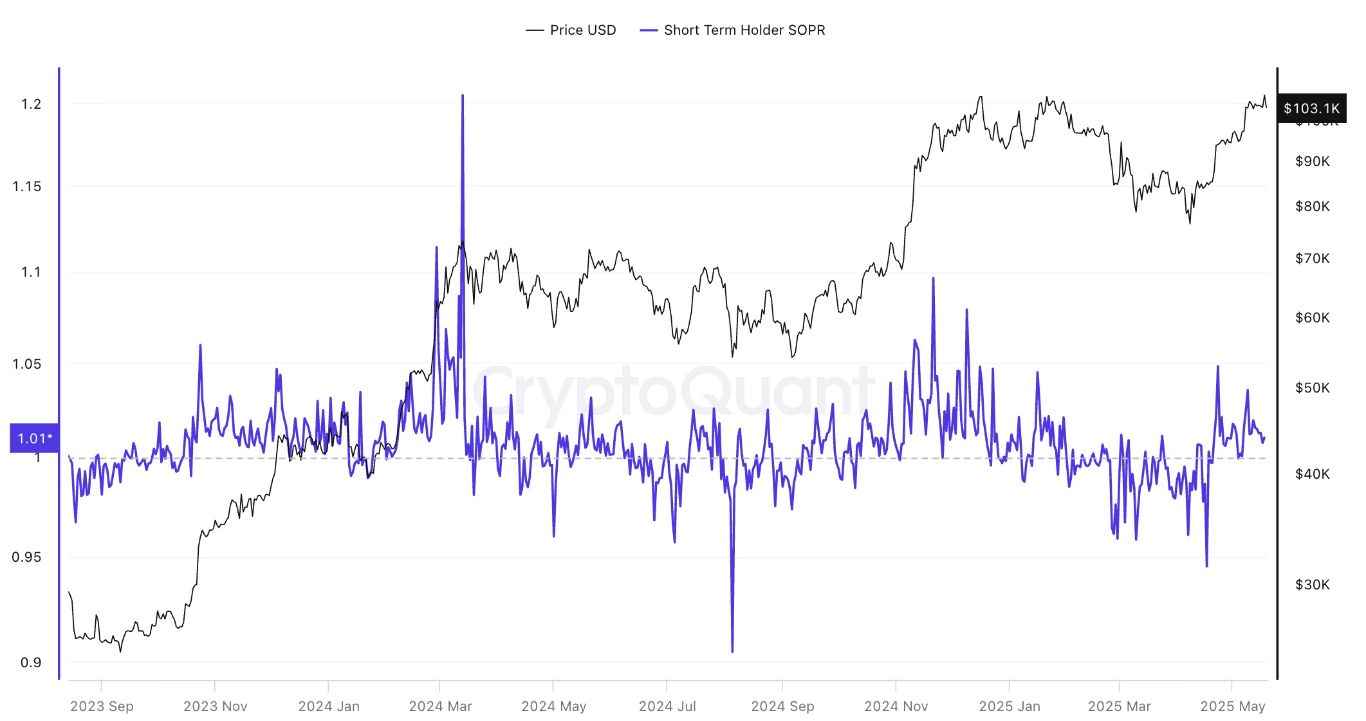
Bitcoin STH SOPR. Source: CryptoQuant
From a technical perspective, the Bitcoin price action has led to the formation of a bull flag pattern in the weekly timeframe, projecting a massive move upward for the flagship cryptocurrency.
A bull flag is a bullish technical chart pattern signalling a potential price continuation upward after a strong rally. It forms when the price consolidates in a downward-sloping channel or range, resembling a flag, following a sharp upward move (the flagpole).
The pattern indicates buyers are pausing before resuming the uptrend. It resolves when the price breaks above the upper trendline of the flag, typically with increased volume, confirming the continuation.
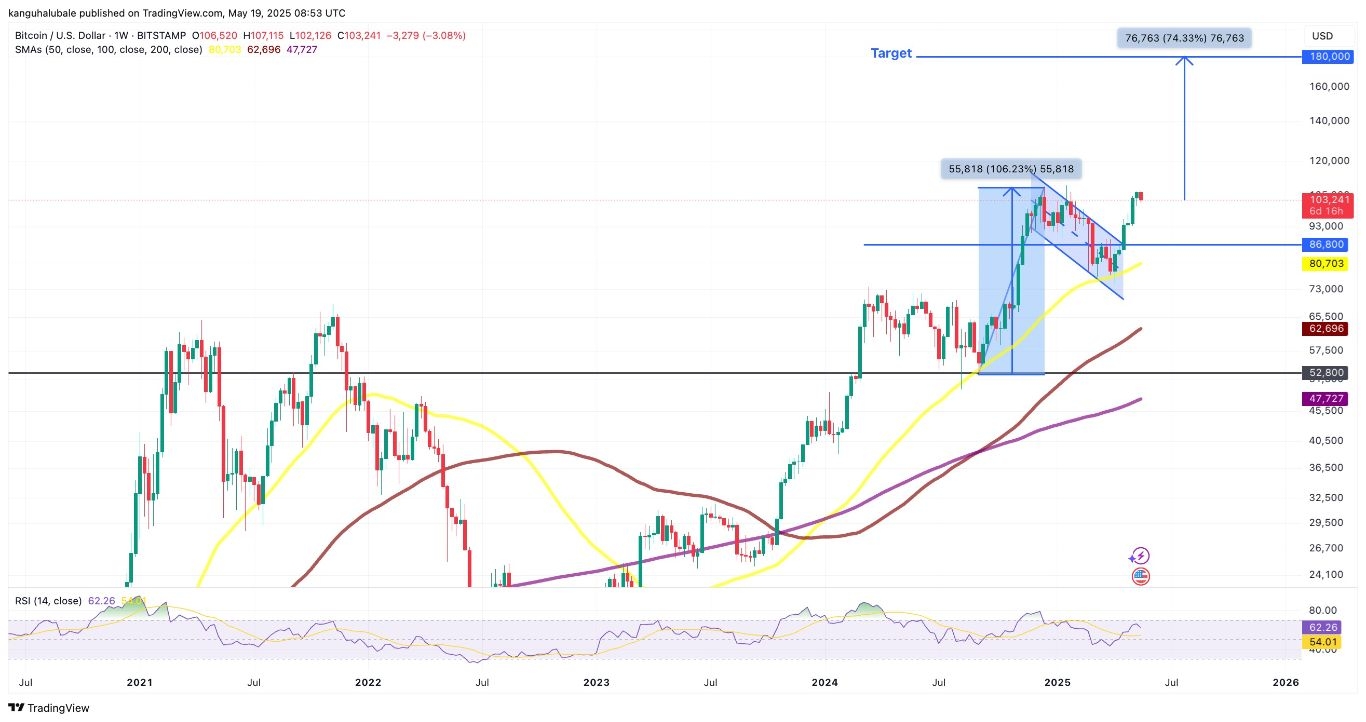 BTC/USD Weekly Chart. Source:TradingView
The bull flag resolved after the price broke above the upper trendline at $86,800 on April 22. Bitcoin could now rise by as much as the previous uptrend’s height. This puts the upper target for BTC price at $180,000. Such a move would represent a 74% price increase from the current levels.
Additionally, Bitcoin’s weekly relative strength index is positive at 62. This suggests that the market conditions still favor further upside, boosting BTC’s chances of reaching its bull flag target.
Ready to trade daily forex forecast? Here are the best MT4 crypto brokers to choose from.

