Bullish view
- Buy the BTC/USD pair and set a take-profit at 110,000.
- Add a stop-loss at 100,000.
- Timeline: 1-2 days.
Bearish view
- Sell the BTC/USD pair and set a take-profit at 100,000.
- Add a stop-loss at 110,000.

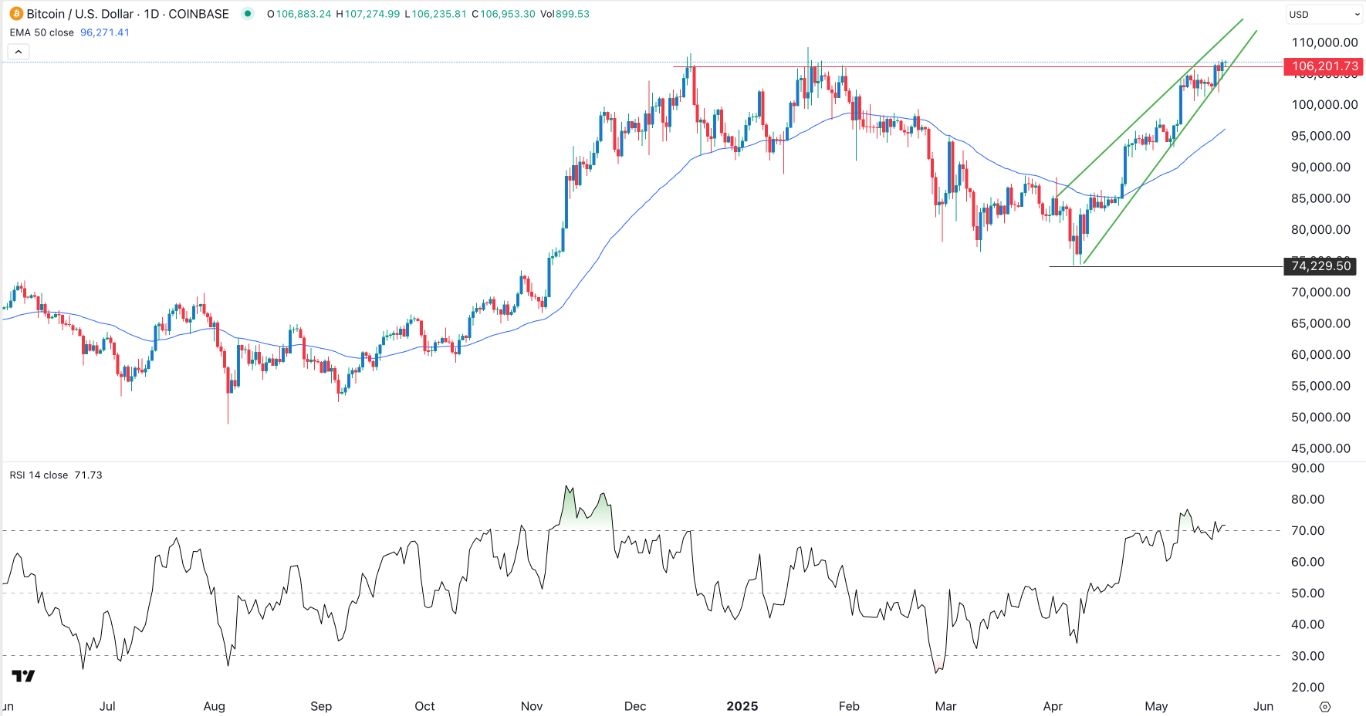
The BTC/USD pair consolidated a few points below the all-time high as traders waited for the next catalyst. Bitcoin price was trading at $106,950, up by over 40% from its lowest point this year.
Bitcoin price prepares for a surge to a record high
The BTC/USD pair held steady as the US Dollar Index (DXY) continued falling, moving to a low of $100. The currency has plunged as investors questioned the safety of the US dollar as a safe haven.
These concerns started after Donald Trump unveiled his tariffs in April and accelerated this week after Moody’s downgraded the US credit rating. The agency slashed the rating from triple A to a notch lower citing the soaring US debt.
All these factors have led to a higher demand for Bitcoin, which analysts believe has become a safe-haven asset. Indeed, recent data showed that investors continued buying spot Bitcoin ETFs.
The total inflows in spot Bitcoin ETFs rose by $667 million on Monday and millions more on Tuesday. This increase has led to cumulative ETF inflows of over $42.45 billion. BlackRock’s iShares Bitcoin ETF has achieved over $66.9 billion in assets, making it a top-ten fund for the company.
BTC/USD Technical Analysis
The daily chart is sending mixed signals on Bitcoin prices. On the positive side, the BTC/USD pair has formed a cup-and-handle pattern, a popular bullish continuation sign in technical analysis.
The other positive sign is that the BTC/USD pair has remained above the 50-day Exponential Moving Average (EMA), a sign that bulls are in control.
On the other hand, there are signs that it has formed two risky chart patterns, pointing to an eventual retreat. It has formed a rising wedge chart pattern, where two ascending trendlines converge.
The BTC/USD pair has formed a triple-top pattern at 108,300 whose neckline is at 74,230. A triple-top is a highly bearish sign in technical analysis. Therefore, the pair will likely have a bearish breakdown and retest the support at 100,000. The alternative scenario is where the pair keeps rising as bulls target 110,000.
Ready to trade our free Forex signals? Here are the best MT4 crypto brokers to choose from.
Crispus Nyaga is a financial analyst, coach, and trader with more than 8 years in the industry. He has worked for leading companies like ATFX, easyMarkets, and OctaFx. Further, he has published widely in platforms like SeekingAlpha, Investing Cube, Capital.com, and Invezz. In his free time, he likes watching golf and spending time with his wife and child.
