With a market capitalization of $310 billion, Ether cements its position as the second most valuable cryptocurrency, according to the CoinMarketCap ranking.
Apart from the uptrend in the wider crypto market fueled by increased inflows into spot Ethereum ETFs and Bitcoin’s rally to fresh all-time highs above $111,000, other fundamental factors and on-chain metrics back Ethereum’s potential to follow in BTC’s footsteps to reach new all-time highs above $5,000 in 2025.
Reducing Supply on Exchanges
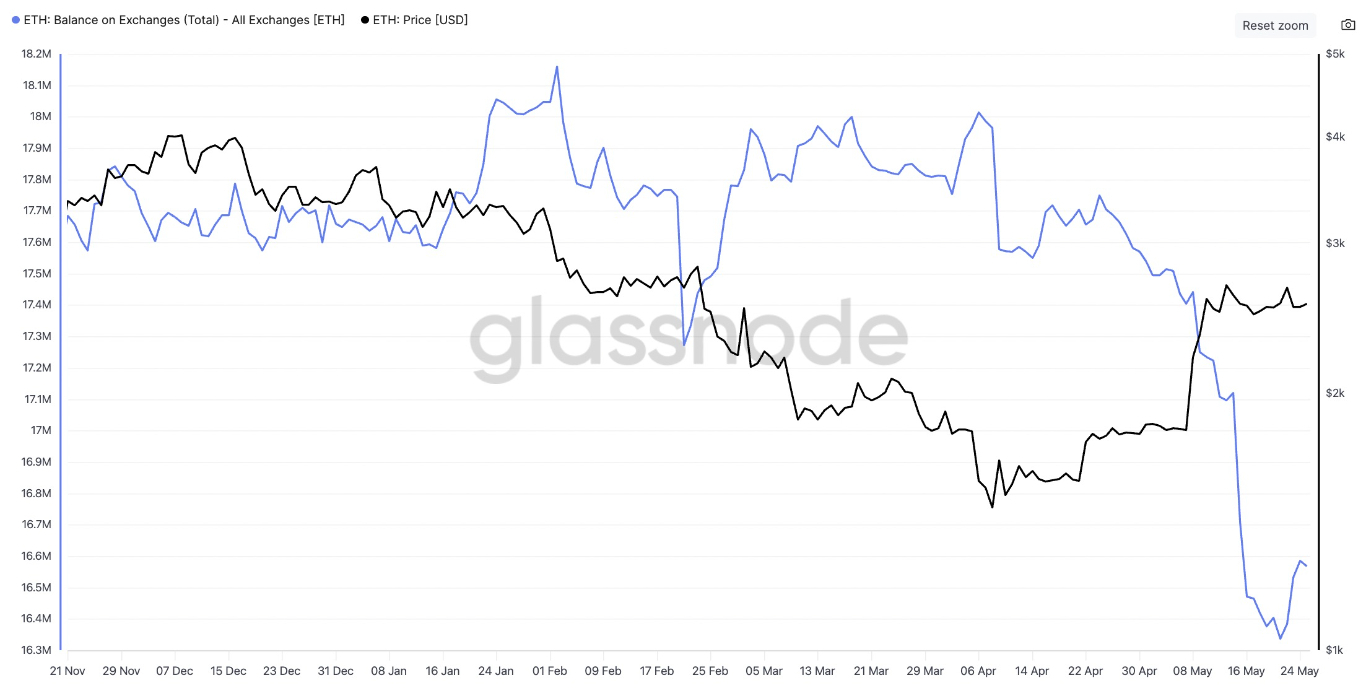
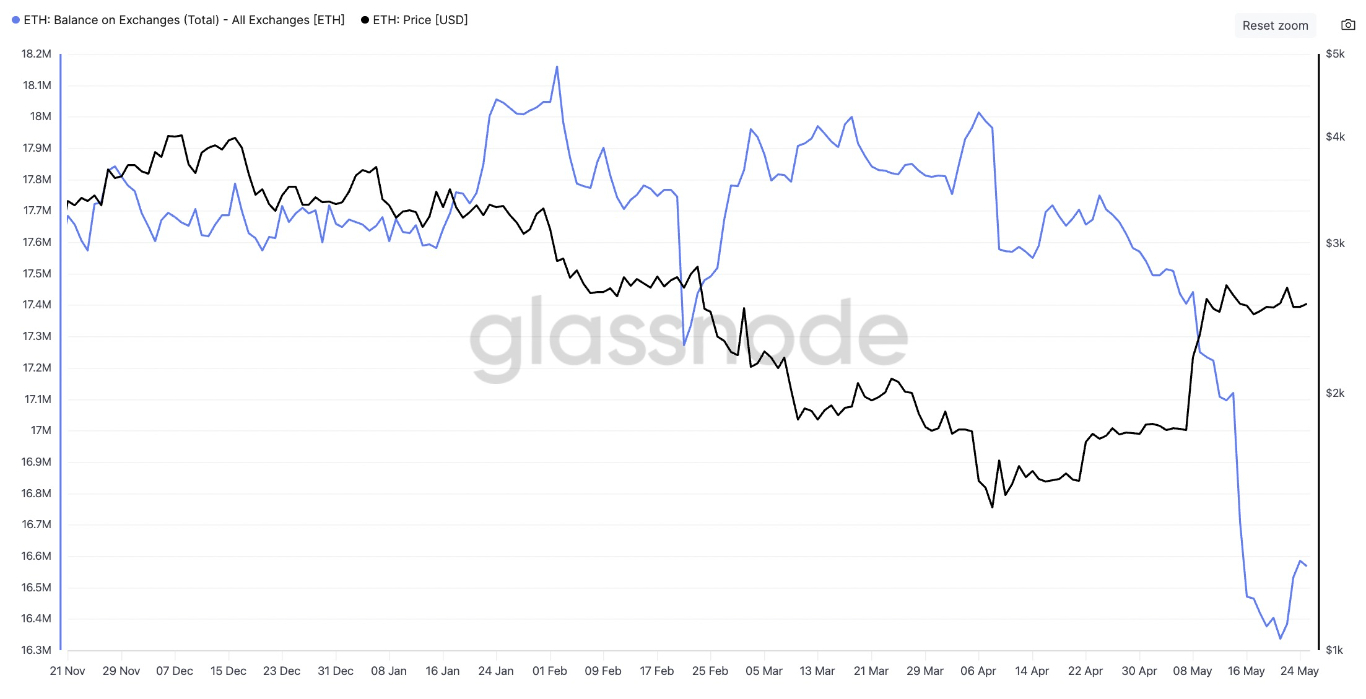
One factor supporting Ether’s upside is reducing supply on exchanges. Data from onchain market intelligence firm Glassnode shows ETH balance on exchanges reached a nine-year low of 16.34 million ETH, after dropping 10% over the last 90 days.
ETH Wallets with Balances Over $100K and $1M. Source: Glassnode
The total balance between inflows and outflows in and out of all known exchange wallets shows a steep decline since October 2023, when withdrawals from the crypto trading platforms began to surge. This drop accompanies an 8% rise in ETH price over the same period.
Decreasing ETH supply on exchanges simply means investors could be withdrawing their tokens into self-custody wallets. This indicates a lack of intention to sell in anticipation of a price increase in the future.
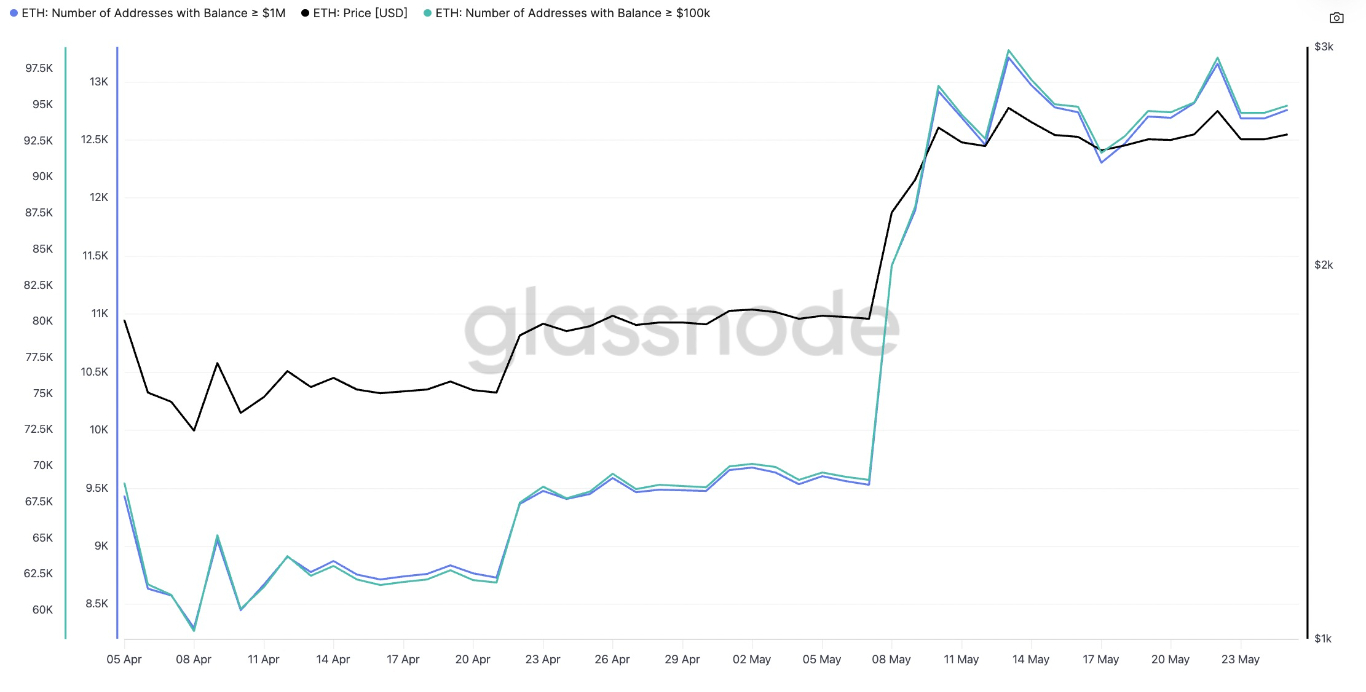
This is explained by a spike in accumulation by large holders over the last few weeks. More data from Glassnode shows that wallets holding $100,000 and $1 million or more worth of ETH have been on the rise since the start of April.+
ETH Wallets with Balances Over $100K and $1M. Source: Glassnode
The chart above shows that the number of wallets holding $100,000 or more has increased from 58,565 on April 8 to 94,976 on May 26. Similarly, those holding $1 million or more have increased by 53% over the same timeframe. This means that whales have not sold during the latest rally in ETH but have continued to accumulate, suggesting most want to position themselves for more gains.
Ethereum’s Open Interest Hits All-Time High
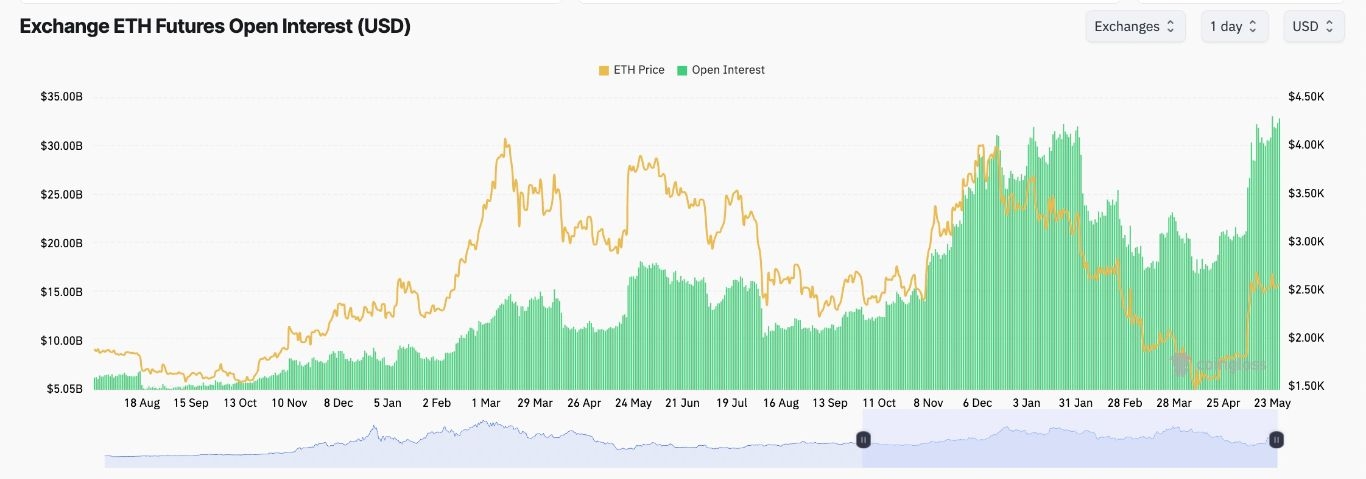
Increased demand for leverage resulted in a surge in ETH futures open interest (OI), which sat around $32.85 billion on May 26, after hitting a record high of $33.1 billion on May 23.
Ether Futures Aggregate Open Interest, USD. Source: CoinGlass
Data from Coinglass shows that Ether futures OI has jumped nearly 91% since April 9, suggesting increased demand for leveraged ETH positions.
Currently, Ethereum’s on-chain and derivatives markets reflect investors’ optimism and continued institutional demand as evidenced by increased inflows into spot Ethereum ETFs.
Data from SoSoValue shows that US-listed spot Ether ETFs saw a total of $307.6 million in net inflows between May 13 and May 26, adding to demand-side pressure.
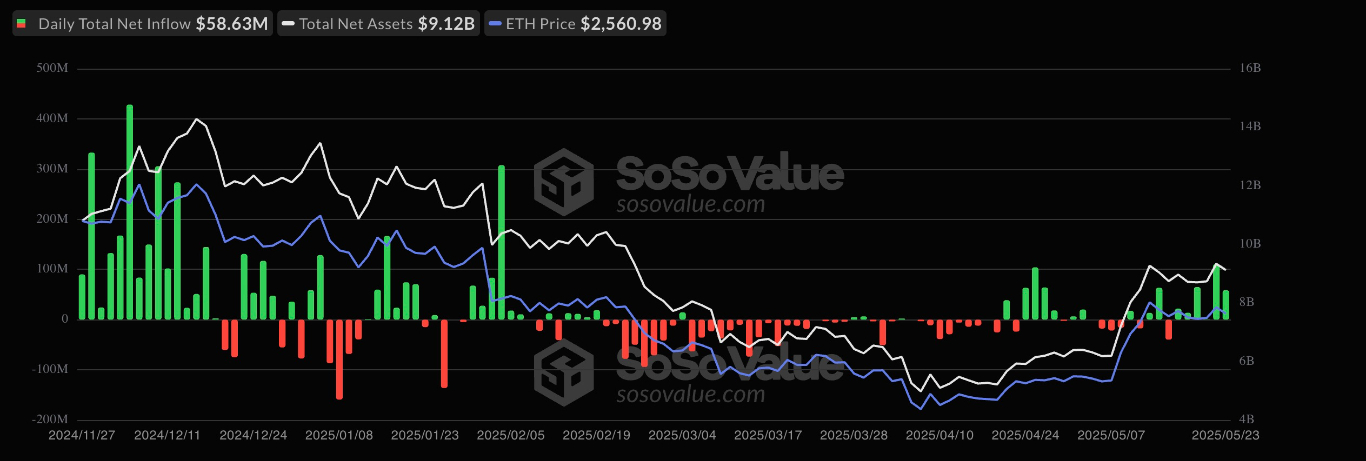
Spot Ethereum ETF Flows Data. Source: SoSoValue
Ether’s Bull Flag Targets $4,000 and Beyond
ETH price has formed a bull flag chart pattern in the daily timeframe, as shown in the chart below.
A bull flag is a bullish chart pattern used in technical analysis to identify potential continuation of an uptrend. It is characterized by a sharp price increase (the “flagpole”), followed by a period of consolidation or consolidation (the “flag”), and then a renewed upward movement. The flag is represented by two parallel trendlines, indicating a period of price stabilization.
It is confirmed when the price breaks out above the upper trendline of the flag, indicating a resumption of the upward trend. The price target after the breakout is calculated by measuring the height of the flagpole and adding it to the breakout point.
In Ethereum’s case, the flag resolved when the price broke above the upper trendline at $2,550 earlier today and could now rise by as much as the previous uptrend’s height. This puts the upper target for ETH price just below $4,000, up 56% from the current price. Higher than that, the next logical move would be the all-time highs close to $5,000, reached on November 10, 2021.
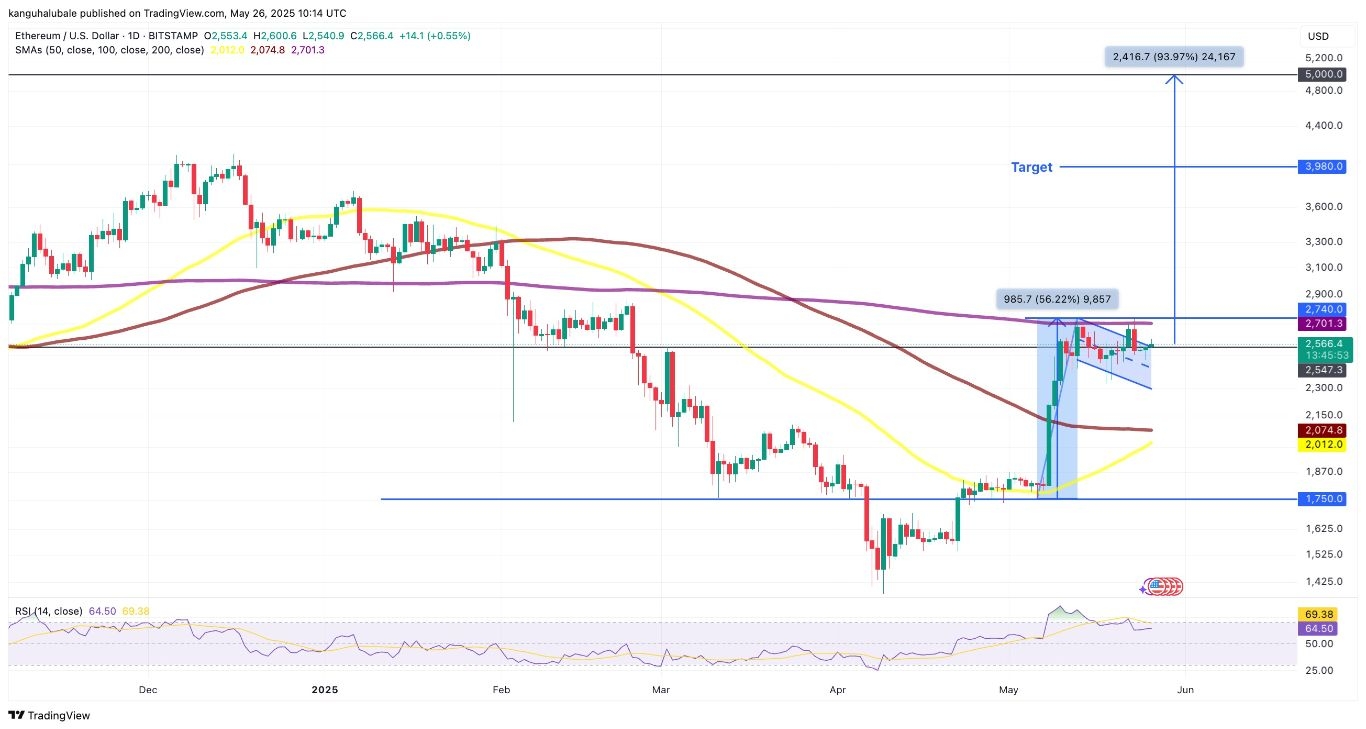
ETH/USD Daily Chart. Source: TradingView
The relative strength index (RSI) is still moving in the positive region at 64, suggesting that the market conditions still favor the upside.
Conversely, a daily candlestick close below the flag’s upper line at $2,550 would see the price plunge back into the consolidation phase. Key support levels to watch on the downside are the lower boundary of the flag at $2,300 and the $2,100 and $2,000 demand zone, where the 100-day and 50-day simple moving averages (SMAs) appear to converge.
In extremely bearish cases, the price could drop toward the beginning of the flag’s pole at $1,750. Such a move would undo all the gains made over the last month.
Ready to trade our daily Forex analysis on crypto? Here’s our list of the best MT4 crypto brokers worth checking out.

