Bullish view
- Buy the BTC/USD pair and set a take-profit at 112,500.
- Add a stop-loss at 107,000.
- Timeline: 1-2 days.
Bearish view
- Sell the BTC/USD pair and set a take-profit at 107,000.
- Add a stop-loss at 112,500.

Bitcoin price held steady above $110,000, helped by the rising demand from institutional investors and companies. The BTC/USD pair soared to 110,500, its highest level since May 23rd, as bulls targeted the all-time high of nearly 111,900.
Bitcoin demand continues to rise
The BTC/USD pair continued soaring as demand for Bitcoin continued rising. In a statement on Tuesday, Trump Media said that it would raise $2.5 billion to buy Bitcoin for its treasuries.
In a separate statement, Blockchain Group, a French company, said that it would raise $72 million in a bond sale to buy 590 Bitcoin for its balance sheet.
Other companies like Meta Planet and Semler Scientific have also continued buying Bitcoin as they emulate Strategy, which has become a $100 billion juggernaut through its Bitcoin accumulation.
Institutional investors have also boosted their exposure to Bitcoin through exchange-traded funds (ETF). Data shows that investors have invested over $43 billion in Bitcoin ETFs since January last year. This includes well-known hedge funds like Susquehanna, Citadel, and Millennium, and market makers like Jane Street.
This demand is rising when the supply of Bitcoin is in a downward trajectory. Data shows that the supply of Bitcoin in exchanges has dropped to the lowest level since 2017. Falling exchange reserves is a sign that investors are not selling their coins.
Bitcoin price also rose as the recent trade worries dropped after Trump extended his tariff threat on European goods. His 50% tariff on European goods will take effect on July 8 and not June 1 as he warned last week. This assurance helped to boost risky assets, with the Dow Jones, and other American indices continuing their uptrend.
BTC/USD Technical analysis
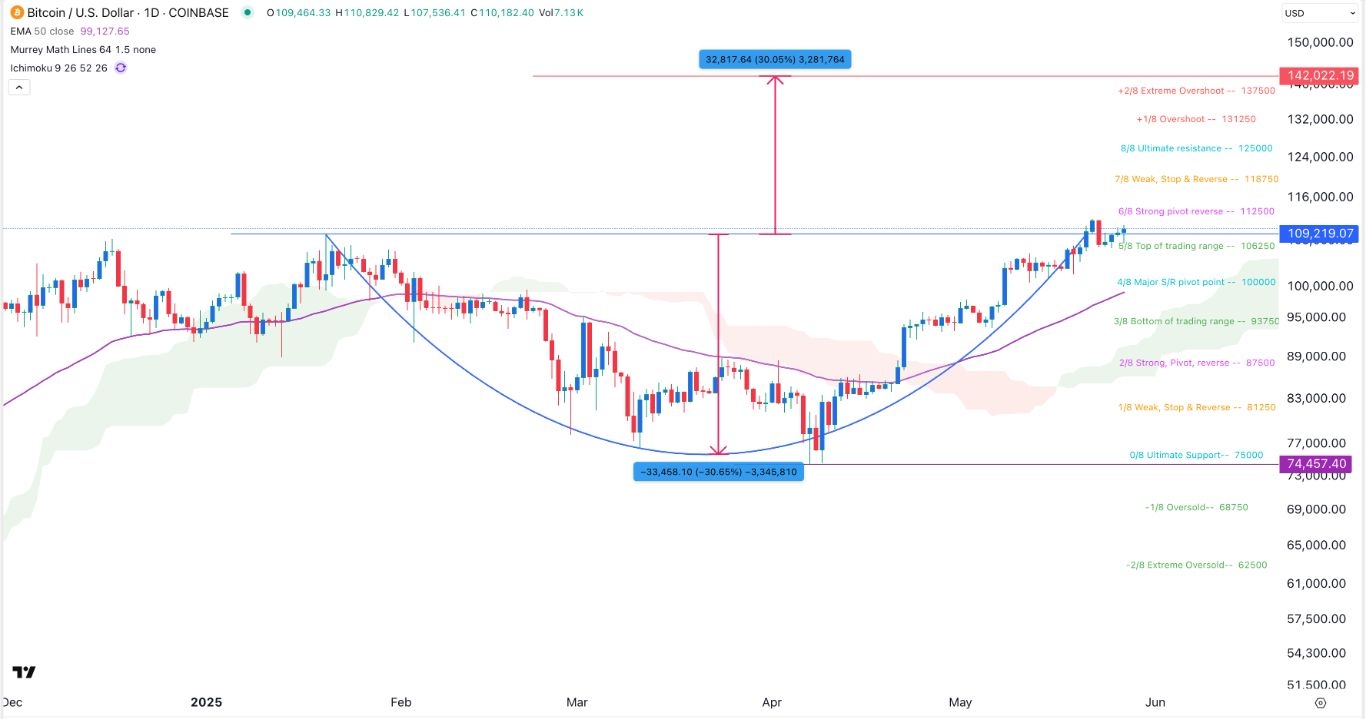
The BTC/USD pair continued its uptrend this week and is now close to its all-time high of 111,900.
Bitcoin has moved above the key resistance level at 109,220, the highest swing on January 20, and the upper side of the cup and handle pattern.
It is also about to get to the strong pivot reverse point of the Murrey Math Lines tool. Bitcoin remains above the Ichimoku Kinko Hyo indicator, a sign that the bullish momentum remains.
Therefore, the BTC/USD pair will likely continue rising as bulls target the all-time high of 111,900. A move above that level will point to more gains to 115,000.
Ready to trade our daily Forex signals? Here’s a list of some of the best crypto brokers to check out.
Crispus Nyaga is a financial analyst, coach, and trader with more than 8 years in the industry. He has worked for leading companies like ATFX, easyMarkets, and OctaFx. Further, he has published widely in platforms like SeekingAlpha, Investing Cube, Capital.com, and Invezz. In his free time, he likes watching golf and spending time with his wife and child.
