Bullish view
- Buy the BTC/USD pair and set a take-profit at 110,000.
- Set a stop-loss at 100,000.
- Timeline: 1-2 days.
Bearish view
- Sell the BTC/USD pair and set a take-profit at 100,000.
- Add a stop-loss at 110,000.

The BTC/USD pair has been under pressure in the past few days as investors prepare for June, Bitcoin’s worst-performing month. Bitcoin was trading at $104,530 on Tuesday, a few points below the year-to-date high of $111,900.
The BTC/USD pair’s sell-off coincided with the performance in the stock market as the Dow Jones, Nasdaq 100, and S&P 500 wavered. Investors are concerned about trade and a potential recession in the United States.
A report by ISM and S&P Global showed that the manufacturing sector in th US continued to worsen last month. The sector is contracting, a move that may continue amid erratic public policy statements from the Trump administration.
For example, steel and aluminium prices jumped on Monday after Trump said that the US would implement a 50% tariffs on imports. He said this as he defended the decision to approve the acquisition of US Steel by Japan’s Nippon Steel.
Bitcoin also retreated as recent data showed that demand for BTC ETFs softened a bit last week. All ETFs had cumulative outflows on Thursday and Friday, a trend that may continue this week.
Investors are worried that June is often the worst month for Bitcoin. The average Bitcoin price return in June is minus 0.80%, the worst month after September. Bitcoin underperforms in June as investors take vacations.
BTC/USD technical analysis
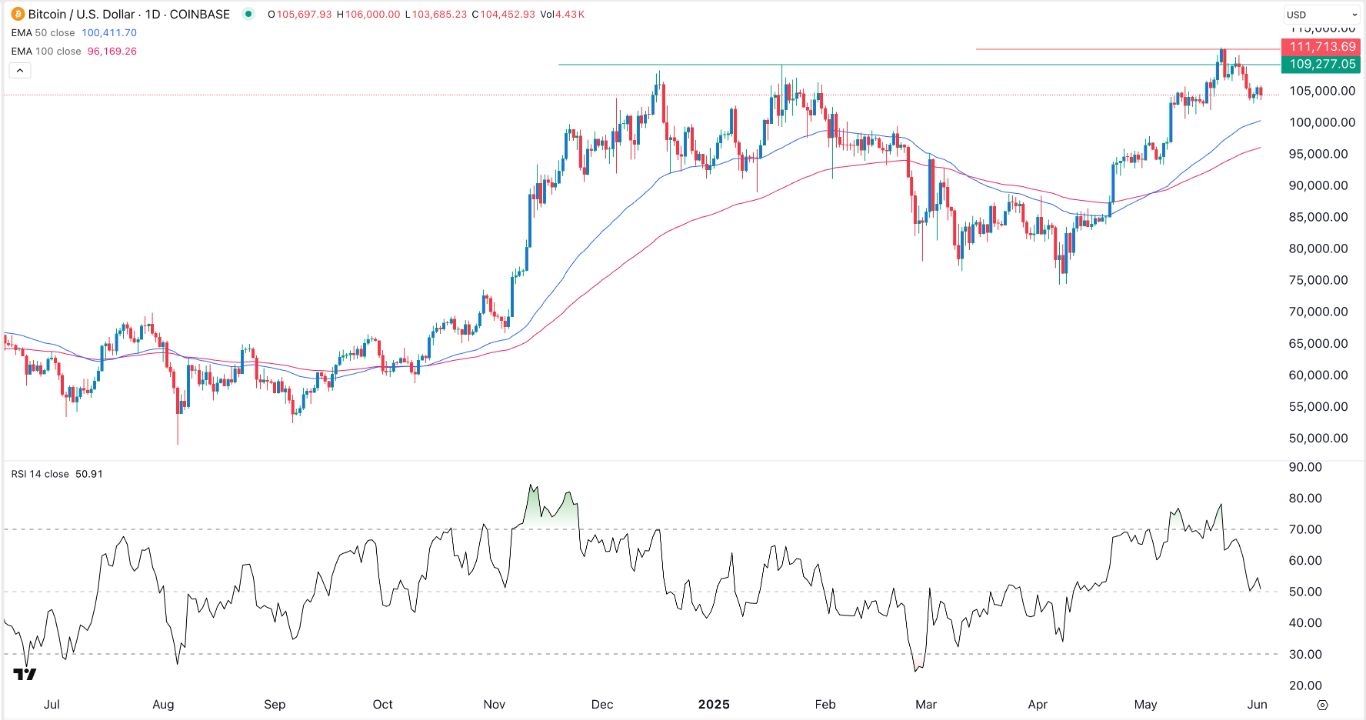
The daily chart shows that the BTC/USD pair jumped to a record high of 111,900 in May, and has now pulled back to below 105,000.
Fortunately, this retreat is part of the formation of the handle section of the cup and handle pattern, a popular bullish continuation sign. This pattern is made up of the cup and the handle sections, and it often results in a strong uptrend.
Bitcoin has moved above the 50-day and 100-day Exponential Moving Averages (EMA), a sign that bulls are in control. However, top oscillators like the Relative Strength Index (RSI) and MACD have pointed downwards.
Therefore, the pair will likely remain in this range as the handle section forms. It will then bounce back later this month, and possibly retest the all-time high of 111,900.
Ready to trade our free Forex signals? Here are the best MT4 crypto brokers to choose from.
Crispus Nyaga is a financial analyst, coach, and trader with more than 8 years in the industry. He has worked for leading companies like ATFX, easyMarkets, and OctaFx. Further, he has published widely in platforms like SeekingAlpha, Investing Cube, Capital.com, and Invezz. In his free time, he likes watching golf and spending time with his wife and child.
