Market Index Analysis
- Tesla (TSLA) is a member of the NASDAQ 100, the S&P 100, and the S&P 500.
- All three indices are at or near record highs, but underlying technical factors show a weakness in the uptrend.
- Most of June, trading volumes during bearish sessions are higher than during bullish sessions.
- The Bull Bear Power Indicator of the NASDAQ 100 shows a negative divergence, which is a bearish sign suggesting a price action reversal could follow.
Market Sentiment Analysis
Equity markets hit fresh records on Friday, and futures suggest more gains ahead at the time of my analysis. Today is the last trading session of the month, of the second quarter, and the first half of 2025. The tech sector has powered the comeback from this year’s lows but may not carry over into the second half. Today’s release of Ernie, developed by Baidu, serves as what some analysts refer to as a “deceleration of war” on expensive AI models, a bearish sign for the US tech sector.
Tesla Fundamental Analysis
Tesla is one of the world’s most valuable companies by market capitalization, but it faces stiff competition from Chinese rivals. The pending US Senate Megabill will make companies like Tesla less profitable, as the company already struggles with declining market share and shrinking profit margins.
So, why am I bearish on TSLA at current levels?
While TSLA continues to generate long-term value for patient investors, the current mix of issues suggests more medium-term pain. It also failed to participate in recent rallies and moved lower as the NASDAQ 100 advanced. The fallout between Elon Musk and President Trump is a temporary distraction but adds to an overall bearish theme.

The price-to-earnings (PE) ratio of 184.93 makes TSLA an expensive stock. By comparison, the PE ratio for the NASDAQ 100 is 40.11.
The average analyst price target for TSLA is 306.07, which suggests an overpriced stock with moderate downside potential.
Tesla Technical Analysis
Today’s TSLA Signal

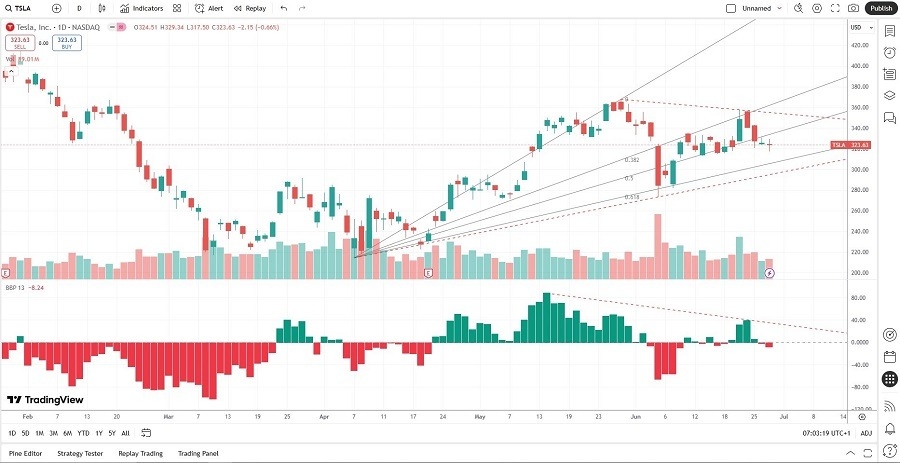
- The TSLA D1 chart shows a breakdown below the 50.0 Fibonacci Retracement Fan.
- It also shows a rising wedge formation, a bearish chart pattern.
- The Bull Bear Power Indicator is contracting and completed a bearish crossover.
- Trading volumes over the past week were higher during risk-off sessions.
- TSLA failed to move higher with markets, a strong bearish signal.
Short Trade Idea
Enter your short position between 311.50 (the low of a previous price gap) and 342.69 (the close of a hammer candlestick at a resistance level that preceded a sharp price drop).
My Call
I am taking a short position in TSLA between 311.50 and 342.69. While I appreciate where Tesla attempts to go in the long term, it faces medium-term issues. The launch of its Robotaxi service provided a short-term boost but is years from profitability. Core markets have scrapped subsidies for electric vehicles, which further adds to Tesla’s profitability issues, as its competition produces better cars for less money.
- TSLA Entry Level: Between 311.50 and 342.69
- TSLA Take Profit: Between 214.25 and 244.43
- TSLA Stop Loss: Between 356.26 and 367.71
- Risk/Reward Ratio: 2.17
