Market Index Analysis
- Costco Wholesale Corporation (COST) is a member of the NASDAQ 100, the S&P 100, and the S&P 500.
- All three indices are at or near record highs, but underlying technical factors suggest volatility ahead with cracks in the strength of the uptrend.
- The Bull Bear Power Indicator of the NASDAQ 100 shows a negative divergence, which is a bearish sign.
Market Sentiment Analysis
Equity markets finished their remarkable second-quarter comeback, and the bullishness could extend this holiday-shortened trading week to start the second half of 2025. Chinese economic data this morning showed an unexpected expansion in June factory activity, which could suffice to push equity markets to a new record. Traders also focus on President Trump’s tariff war, which could keep US inflation on an upward trajectory and interest rates higher for longer.
Costco Wholesale Corporation Fundamental Analysis
Costco Wholesale Corporation is one of the world’s largest retailers and the biggest one for beef, poultry, organic produce, and wine. Over 30% of Americans shop at Costco Wholesale Corporation regularly, which drives value with its in-house brand. It currently has 905 warehouses serving 130M+ members.
So, why am I bearish on COST after the recent sell-off?
COST will face the pricing pressure from higher inflation, which could turn into a stagflationary scenario moving forward. While it has pricing power due to its business model, the current share price remains overly optimistic. Its low-dividend yield makes it unattractive for long-term portfolios, and its gross margin is worse than 85% of its competitors. It has increased its share count, and its current ratio is vulnerable to economic shocks.

Costco Wholesale Corporation Fundamental Analysis Snapshot
The price-to-earning (PE) ratio of 56.15 makes COST an expensive stock. By comparison, the PE ratio for the NASDAQ 100 is 40.11.
The average analyst price target for COST is 1,056.36, with moderate upside potential. I see more risks in the medium term.
Costco Wholesale Corporation Technical Analysis
Today’s COST Signal

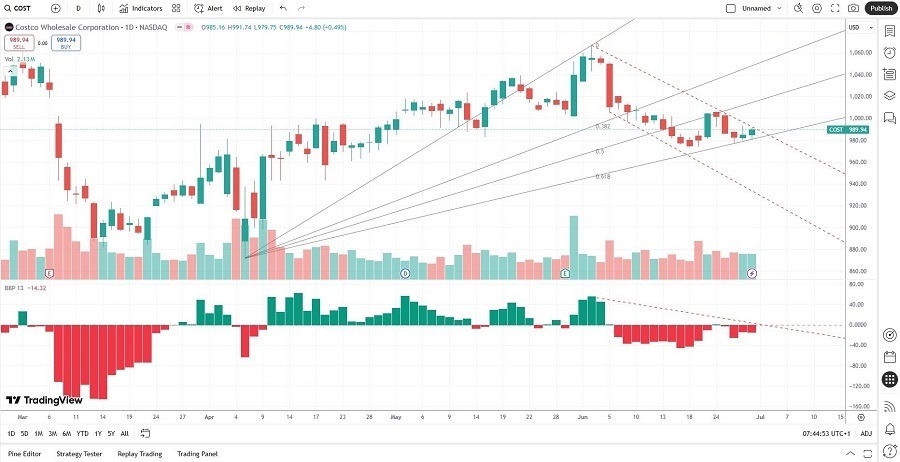
- The COST D1 chart shows price action at its 61.8 Fibonacci Retracement Fan following a double breakdown with increasing bearish pressures.
- It also shows a bearish price channel, which could guide price action lower.
- The Bull Bear Power Indicator traded in bearish territory for most of June.
- Trading volumes over the past week were higher during risk-off sessions.
- COST has decreased as markets pushed higher, a strong bearish signal.
Short Trade Idea
Enter your long position between 976.50 (the low of its latest bearish candle) and 991.74 (the upper descending resistance level of its bearish price channel).
My Call
I am taking a short position in COST between 976.50 and 991.74. The current macroeconomic environment could extend the sell-off in Costco Wholesale Corporation, and I am wary of the current ratio and gross margins. The technical picture features bearish indicators and trends to overpower any short-term bullish comeback attempt. With tariff uncertainty, high inflation, and cracks in the labor market, the next earnings call and outlook could drive prices lower.
- COST Entry Level: Between 976.50 and 991.74
- COST Take Profit: Between 871.71 and 897.67
- COST Stop Loss: Between 1,020.63 and 1,053.74
- Risk/Reward Ratio: 2.38
Ready to trade our free signals? Here is our list of the best stock trading platforms worth checking out.
