Market Index Analysis
- The Coca-Cola Company (KO) is a member of the NASDAQ 100, the S&P 100, and the S&P 500
- All three indices are near record highs, but cracks in the bullish trend have emerged.
- The Bull Bear Power Indicator of the S&P 500 shows a negative divergence, which is a bearish signal hinting at a potential price action reversal.
Market Sentiment Analysis
Equity markets began the third quarter and the second half with a moderate decrease, but this week’s holiday-shortened week is unlikely to produce a significant move. All eyes are on US President Trump’s Megabill, which passed the Senate, but still lacks sufficient votes in the House. President Trump also signaled that he is unwilling to extend the July 9th 90-day deadline to reach a trade deal, and he doubted reaching a trade deal with Japan before then. Tariff uncertainty could magnify selling pressure this week.
Coca-Cola Company Fundamental Analysis
The Coca-Cola Company is one of the world’s largest beverage companies, with a recent push into healthy alternatives and bottled water. It began paying dividends in 1920, and as of 2019, has increased its dividend for 57 consecutive years. It enjoys a high level of brand loyalty and excellent profit margins.
So, why am I bullish on KO despite weakening economic fundamentals?
KO has a brand loyalty that fares well during economic uncertainty, as it is one of the small luxuries which consumers often maintain when their budget gets tight. KO also has pricing power that holds up well against inflationary pressures, and its stable dividend and reasonable dividend yield of nearly 3.00% add to its long-term portfolio potential.

The price-to-earning (PE) ratio of 28.78 makes KO a reasonably priced stock. By comparison, the PE ratio for the S&P 500 is 28.59.
The average analyst price target for KO is 77.83, which suggests moderate upside potential. I expect KO to hit this target in the second half of 2025.
Coca-Cola Company Technical Analysis
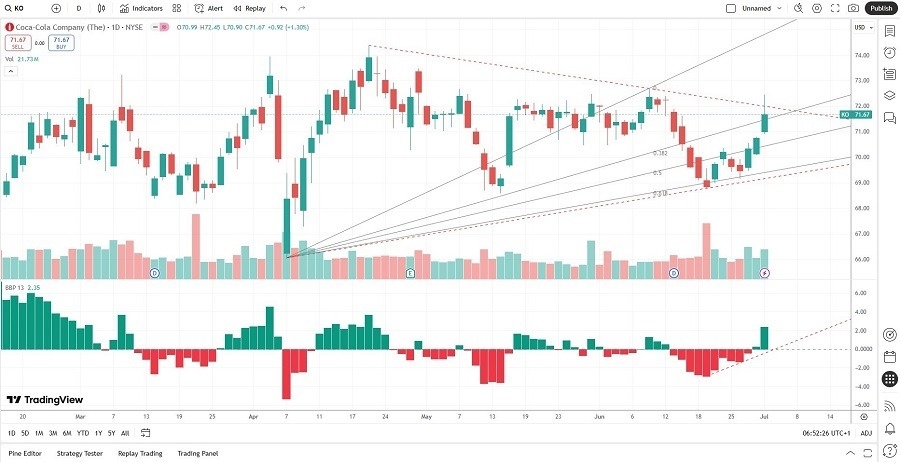
Today’s KO Signal

- The KO D1 chart shows price action climbing the Fibonacci Retracement Fan with a double breakout.
- It also shows price action piercing the descending resistance level of its ascending triangle formation, a continuation pattern.
- The Bull Bear Power Indicator confirms the recent advance.
- Trading volumes over the past week were higher during risk-on sessions.
- KO bucked yesterday’s risk-off session and moved higher.
Long Trade Idea
Enter your long position between 70.90 (the intra-day low of yesterday’s bullish candle) and 72.45 (the intra-day high of yesterday’s bullish candle).
My Call
I am taking a long position in KO between 70.90 and 72.45. Volatility could increase, but I expect KO to maintain its bullish trend and outperform the S&P 500. Its profit margins and brand loyalty should protect it from significant downside shocks, and I consider any sell-off as a long-term buying opportunity for my dividend portfolio.
- KO Entry Level: Between 70.90 and 72.45
- KO Take Profit: Between 80.17 and 82.58
- KO Stop Loss: Between 66.05 and 67.76
- Risk/Reward Ratio: 1.91
Ready to trade our free signals? Here is our list of the best stock trading platforms worth checking out.
