Bullish view
- Buy the BTC/USD pair and set a take-profit at 115,000.
- Add a stop-loss at 104,000.
- Timeline: 1-2 days.
Bearish view
- Sell the BTC/USD pair and set a take-profit at 104,000.
- Add a stop-loss at 115,000.

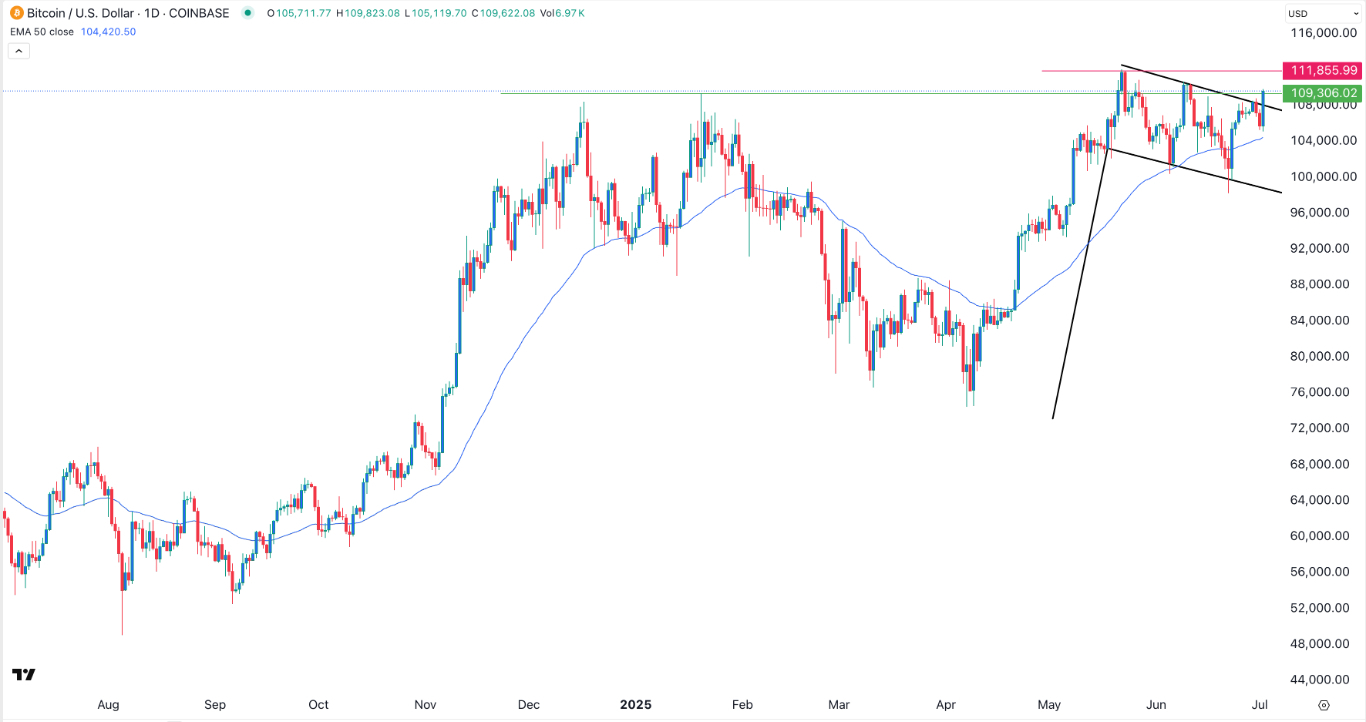
Bitcoin price made a strong bullish breakout after days of consolidation as bulls targeted its all-time high. The BTC/USD pair reached a high of 110,000 for the first time in nearly a month. It has jumped by over 11% from its lowest level this month.
Bitcoin price surges ahead of NFP data
The BTC/USD pair continued to rise as investors adopted a risk-on sentiment ahead of the non-farm payrolls data. For example, the fear and greed index has moved to the greed zone, while American stock indices like the Nasdaq 100 and S&P 500 have jumped to their all-time highs.
The risk-on sentiment increased after ADP published a weak nonfarm jobs data. Its report showed that the economy lost over 33,000 jobs in June, a big reversal after it added 29,000 in the previous month.
This report came a day before the Bureau of Labor Statistics (BLS) publishes the official jobs numbers. Historically, these are often some of the most significant macro numbers because they are part of the Federal Reserve’s dual mandate.
A weak NFP data will put pressure on the Fed to start interest rate cuts as soon as in its July meeting. Bitcoin and other risky assets do well when the bank is cutting interest rates.
The BTC/USD pair also did well as investors continued buying in Wall Street. Data shows that spot ETFs have accumulated over $48.63 billion in assets since their inception last year. BlackRock’s IBIT ETF now holds almost $74 bilion in assets, making it one of the most bullish patterns in technical analysis.
BTC/USD technical analysis
The daily chart shows that the BTC/USD pair made a strong bullish breakout that could push it to a record high. It formed a bullish engulfing pattern, a popular continuation sign. It also moved above the upper side of the descending channel pattern.
Bitcoin has also moved slightly above the important resistance level at 109,300, the upper side of the cup-and-handle pattern. It has also moved above the 50-day and 100-day Exponential Moving Averages (EMA).
The Relative Strength Index (RSI) has pointed upwards. Therefore, it will likely continue rising as bulls target the psychological point at 115,000. A drop below the support at 105,000 will invalidate the bullish outlook.
Ready to trade our free Forex signals? Here are the best MT4 crypto brokers to choose from.
Crispus Nyaga is a financial analyst, coach, and trader with more than 8 years in the industry. He has worked for leading companies like ATFX, easyMarkets, and OctaFx. Further, he has published widely in platforms like SeekingAlpha, Investing Cube, Capital.com, and Invezz. In his free time, he likes watching golf and spending time with his wife and child.
