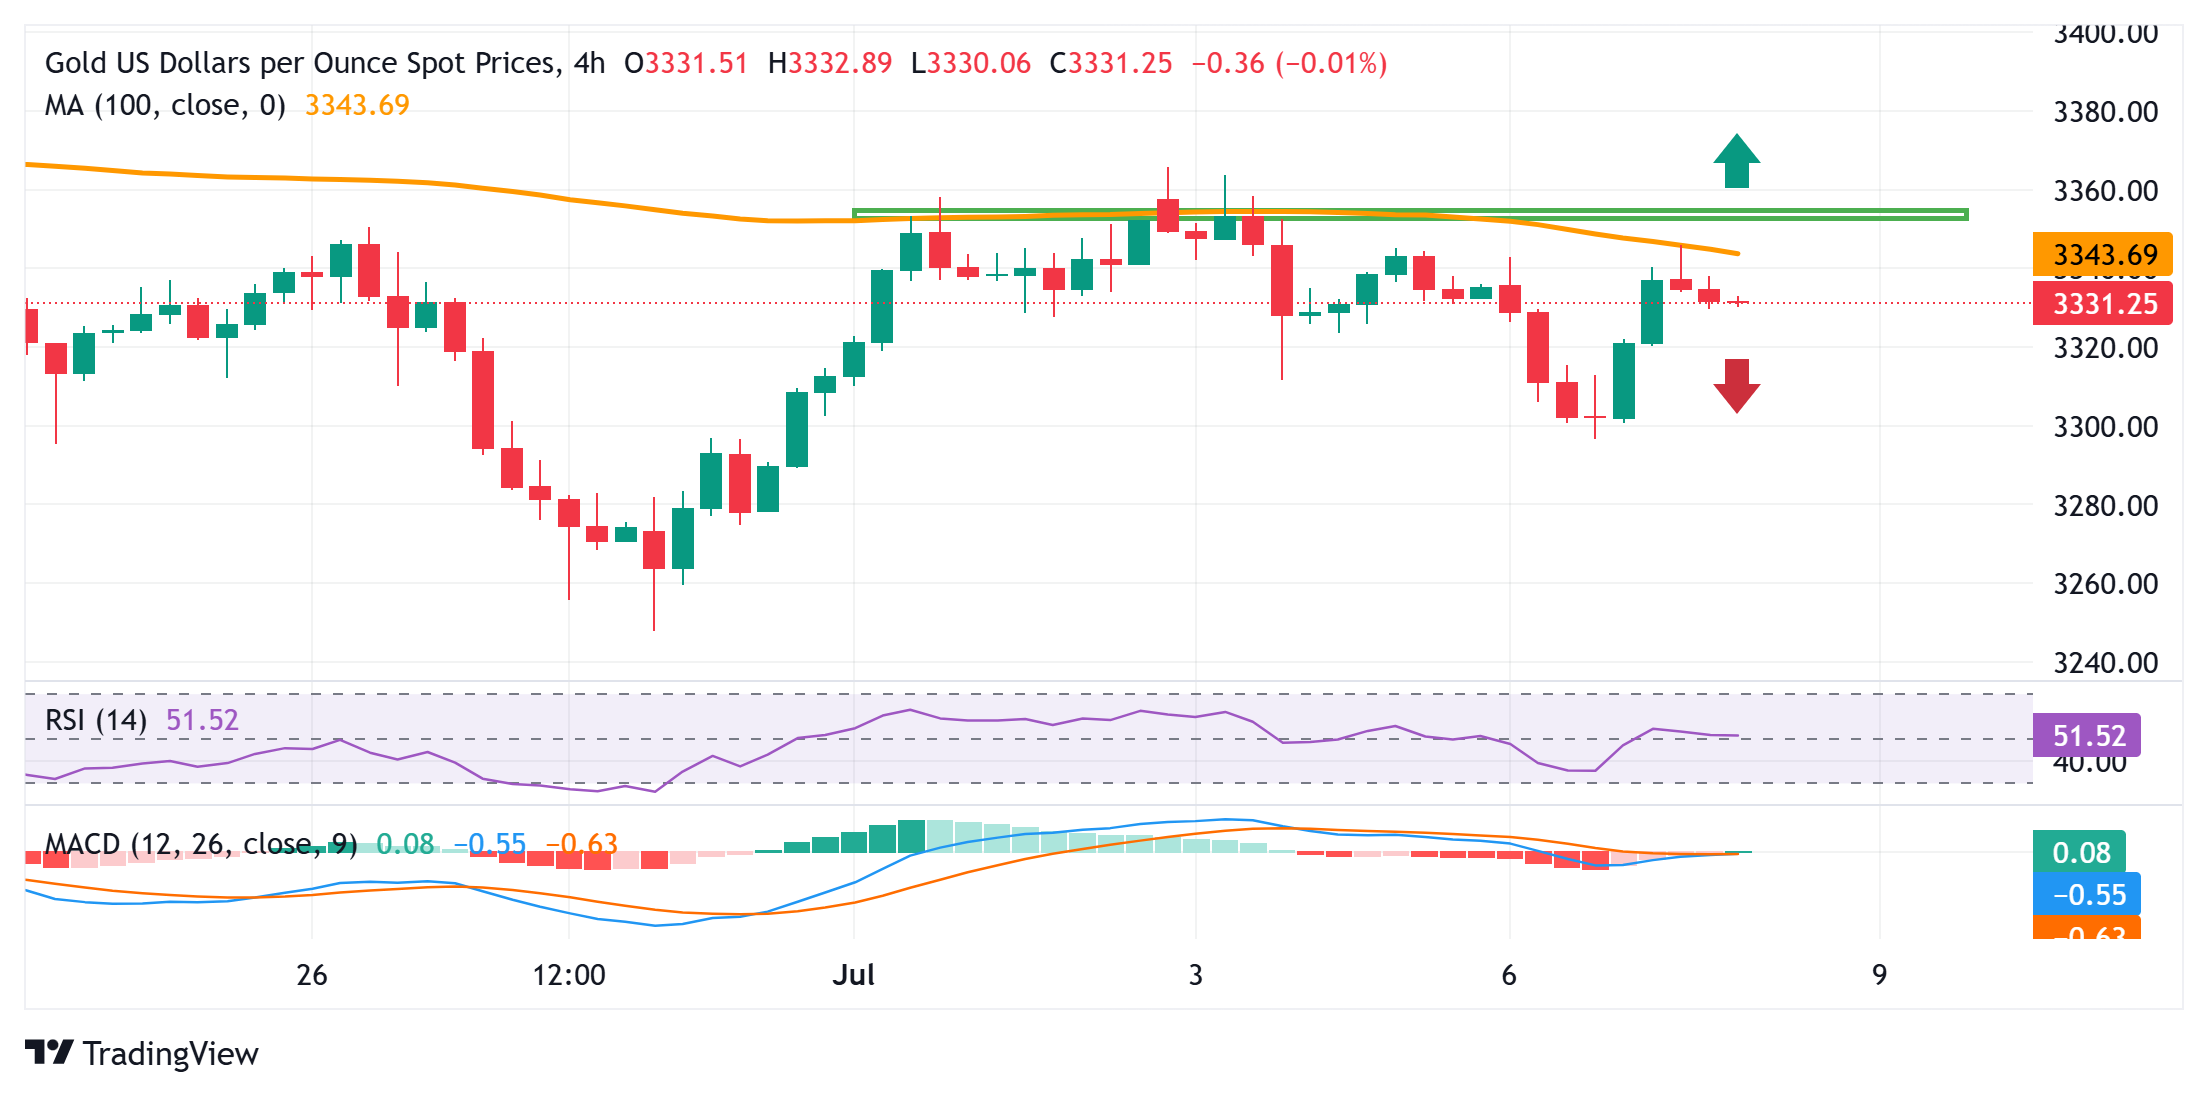
- Gold price edges lower on Tuesday amid diminishing odds for a rate cut by the Fed in July.
- Concerns about the economic fallout from Trump’s tariffs weigh on investors’ sentiment.
- The emergence of some USD weakness contributes to limiting losses for the XAU/USD pair.
Gold price (XAU/USD) sticks to modest intraday losses through the early European session on Tuesday, though it lacks follow-through selling amid a combination of diverging forces. Investors now seem convinced that the Federal Reserve (Fed) will keep interest rates steady amid expectations that US President Donald Trump’s tariffs would underpin US inflation. This, in turn, is seen as a key factor acting as a headwind for the non-yielding yellow metal.
However, worries about the potential economic fallout from Trump’s trade tariffs and US fiscal concerns fail to assist the US Dollar (USD) in attracting any meaningful buyers. Apart from this, persistent geopolitical risks offer some support to the safe-haven Gold price and help limit deeper losses. Traders also seem reluctant and opt to wait for more cues about the Fed’s rate-cut path. Hence, the focus will remain glued to the release of FOMC minutes on Wednesday.
Daily Digest Market Movers: Gold price bears seem non-committed amid trade jitters
- US President Donald Trump extended the deadline for the imposition of reciprocal tariffs to August 1 and also released letters outlining higher trade tariffs against a slew of Asian and African countries. Trump also threatened that any Country aligning with the anti-American policies of BRICS will be charged an additional 10% tariff and there will be no exceptions to this policy.
- The Federal Reserve is now expected to keep interest rates elevated in anticipation of worsening inflation as a result of higher import taxes and a still resilient US labor market. This, in turn, lifted the US Dollar to a nearly two-week high on Monday and turned out to be a key factor that undermines demand for the non-yielding Gold price during the Asian session on Tuesday.
- The USD bulls, however, seem reluctant amid the uncertainty over the potential economic impact of Trump’s tariffs and US fiscal concerns. Adding to this, a fresh wave of the global risk-aversion trade – as depicted by a sea of red across the global equity markets – could lend support to the safe-haven precious metal and warrants caution for aggressive bearish traders.
- In the absence of any relevant market-moving economic data from the US on Tuesday, the market focus will remain glued to the release of FOMC meeting minutes on Wednesday. Investors will look for more cues about the Fed’s rate-cut path, which, in turn, will drive the USD demand in the near term and provide a fresh directional impetus to the non-yielding yellow metal.
Gold price repeated failures near 100-SMA on H4 back the case for deeper losses

The overnight goodish rebound faced rejection near the 100-period Simple Moving Average (SMA) on the 4-hour chart. The said barrier is currently pegged near the $3,347-3,348 region and is followed by $3,358-3,360 supply zone. A sustained strength beyond the latter could trigger a short-covering move and allow the Gold price to reclaim the $3,400 round figure.
On the flip side, the $3,300-3,295 area might continue to protect the immediate downside, below which the XAU/USD pair could accelerate the fall towards the next relevant support near the $3,270 horizontal zone. The downward trajectory could get extended and eventually drag the Gold price to the $3,248-3,247 region, or the June monthly swing low.
US Dollar PRICE Today
The table below shows the percentage change of US Dollar (USD) against listed major currencies today. US Dollar was the strongest against the Japanese Yen.
| USD | EUR | GBP | JPY | CAD | AUD | NZD | CHF | |
|---|---|---|---|---|---|---|---|---|
| USD | -0.40% | -0.28% | 0.00% | -0.29% | -0.76% | -0.45% | -0.30% | |
| EUR | 0.40% | 0.11% | 0.43% | 0.11% | -0.39% | -0.05% | 0.10% | |
| GBP | 0.28% | -0.11% | 0.32% | 0.00% | -0.50% | -0.17% | -0.01% | |
| JPY | 0.00% | -0.43% | -0.32% | -0.31% | -0.79% | -0.42% | -0.22% | |
| CAD | 0.29% | -0.11% | 0.00% | 0.31% | -0.50% | -0.16% | -0.01% | |
| AUD | 0.76% | 0.39% | 0.50% | 0.79% | 0.50% | 0.34% | 0.49% | |
| NZD | 0.45% | 0.05% | 0.17% | 0.42% | 0.16% | -0.34% | 0.16% | |
| CHF | 0.30% | -0.10% | 0.00% | 0.22% | 0.00% | -0.49% | -0.16% |
The heat map shows percentage changes of major currencies against each other. The base currency is picked from the left column, while the quote currency is picked from the top row. For example, if you pick the US Dollar from the left column and move along the horizontal line to the Japanese Yen, the percentage change displayed in the box will represent USD (base)/JPY (quote).

