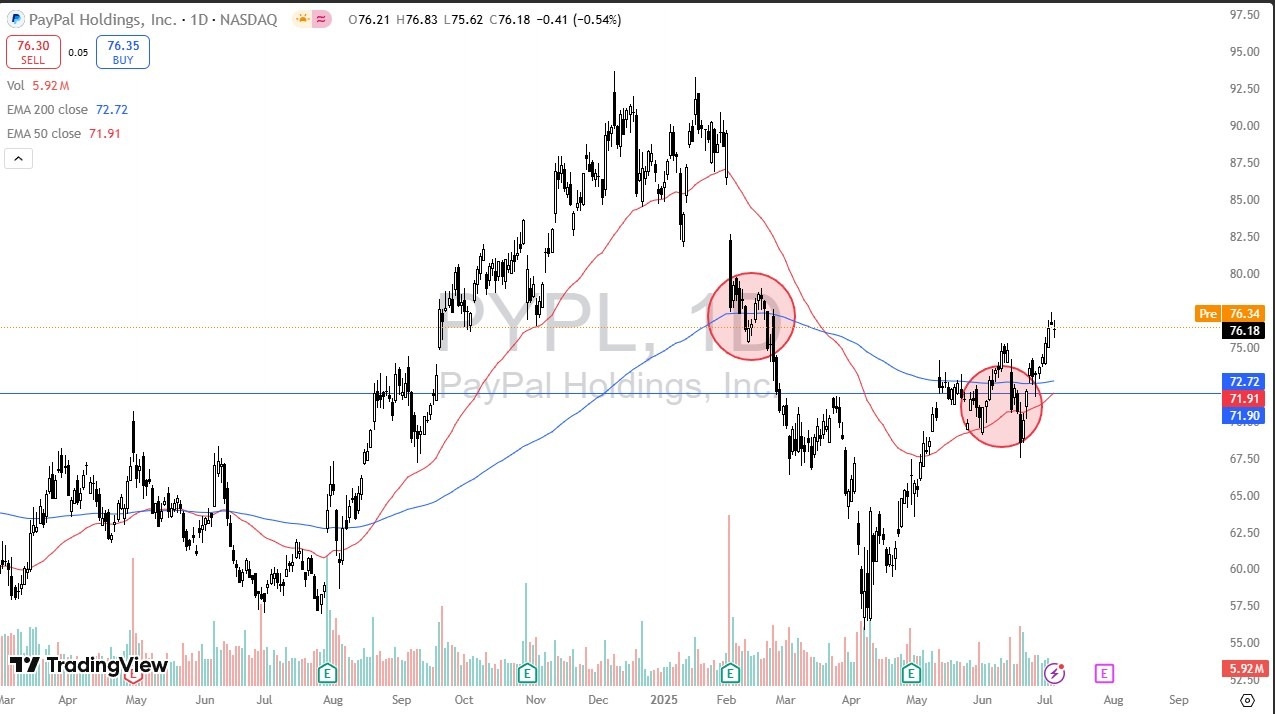
- During premarket trading on Tuesday, PayPal has shown a little bit of strength, but it is worth noticing that if you look far enough on the left-hand side of the chart, you can see that this is an area that has been fairly noisy in the past, as denoted by the red circle.
- On the other hand, we have a red circle on the chart near the $72 level underneath that should offer support.
- The fact that the market has stretched as much as it has over the last couple of sessions does suggest that perhaps we need a little bit of a pullback to continue the momentum.

Technical Analysis
The technical analysis for PayPal is rather strong, as it is worth noting that the most recent selloff that reached the $67.50 level has seen a little bit of an increase in volume in the market before forming a “V pattern.” The Monday candlestick ended up being a shooting star in an area that should offer a bit of resistance, and although PayPal is a market that I believe is looking to the $82.50 level, traders would be well advised to pay close attention to the market for pullbacks in offer value. It appears that the $72 area should offer a bit of support, extending down to that previously mentioned $67.50 level.
I have no interest in shorting PayPal, and it’s probably also worth noting that we are about to get the so-called “golden cross”, when the 50 Day EMA crosses above the 200 Day EMA, which is a longer-term bullish signal for “buy-and-hold investors.” I think all of this coming together in the fact that the United States economy is still producing jobs despite the fact that Armageddon was forecast, it does make a certain amount of sense that PayPal continues to attract a bit of inflows, right along with many other financial stocks.
Going forward, PayPal looks very much like a buy on the dip scenario, and as long as the market stays above the $67.50 level, it’s very likely that most traders out there will be looking at it through the same prism. Pay attention to the indices of course, because you don’t want to see some massive selloff have a detrimental effect on your trade here, but if the overall indices are pulling back slightly, that might be your clue to start looking for value.
Ready to trade our stock market forecast and analysis? Here are the best CFD stocks brokers to choose from.
Christopher Lewis has been trading Forex and has over 20 years experience in financial markets. Chris has been a regular contributor to Daily Forex since the early days of the site. He writes about Forex for several online publications, including FX Empire, Investing.com, and his own site, aptly named The Trader Guy. Chris favours technical analysis methods to identify his trades and likes to trade equity indices and commodities as well as Forex. He favours a longer-term trading style, and his trades often last for days or weeks.
