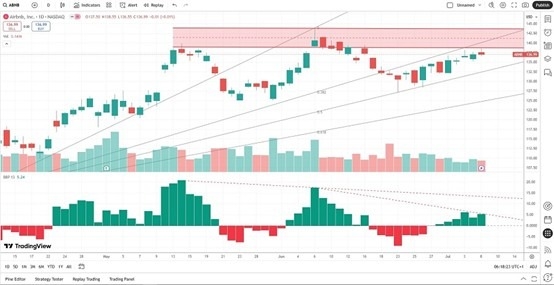
Short Trade Idea
Enter your short position between 135.20 (the intra-day low of its last bullish candle) and 140.64 (the close of an inverted hammer candle marking its second quarter peak).
Market Index Analysis
- Airbnb (ABNB) is a member of the NASDAQ 100 and the S&P 500.
- Both indices are near record highs, but trading volumes during sell-off have increased, suggesting a potential breakdown of the uptrend.
- The Bull Bear Power Indicator of the NASDAQ 100 shows a negative divergence, and half of a head-and-shoulders pattern, a reversal chart pattern.
Market Sentiment Analysis
Equity markets continue to assess the latest round of tariff news and weigh it against the initial market shock of April. The impressive V-shaped recovery during the second quarter now faces more uncertainty against the backdrop of high inflation, higher-than-expected interest rates, and a cooling economy. Recent comments about a tariff-related inflation spike and comparing them to the risk of a meteor strike or another pandemic show the economic disconnect of current policy, which adds to the risks of a third-quarter correction.
Airbnb Fundamental Analysis
Airbnb is the best-known online marketplace and broker for short-term rentals and long-term homestays. Despite its permanent ban on parties and events, the company continues to face stiff opposition to its properties in core markets.
So, why am I bearish on ABNB despite its recent advance?
The primary reason is its double-digit contraction in earnings per share. The high valuations fail to justify the current share price, and I do not see medium-term bullish catalysts to drive price action higher. Economic uncertainty could result in a weaker-than-hoped-for summer travel season. It could deliver another earning disappointment like in 2023. With the price close to the average analyst target, the downside risks far exceed the upside potential.
|
Metric |
Value |
Verdict |
|
PE Ratio |
34.77 |
Bearish |
|
PB Ratio |
10.65 |
Bearish |
|
PEG Ratio |
1.95 |
Bearish |
|
Current Ratio |
1.27 |
Bearish |
|
ROIC-WACC Ratio |
Positive |
Bullish |
The price-to-earnings (PE) ratio of 34.77 makes ABNB an expensive stock. By comparison, the PE ratio for the S&P 500 is 28.75.
The average analyst price target for ABNB is 138.70. It shows limited perceived upside potential from current levels.
Airbnb Technical Analysis
Today’s ABNB Signal

- The ABNB D1 chart shows price action at a significant horizontal resistance zone.
- It also shows the Fibonacci Retracement Fan level acting as ascending resistance.
- A bearish head-and-shoulders pattern, a reversal pattern, has formed.
- The Bull Bear Power Indicator is bullish but has created a series of lower highs, to confirm bearish conditions.
- The average trading volumes during selloffs are higher than during advances.
My Call
Consider taking a short position in ABNB between 135.20 and 140.64 if there is bearish price action there. Airbnb has limited upside potential with rising downside risks stemming from its earnings per share decrease, a fast-changing perception of its properties, and socioeconomic issues. Economic uncertainty and stubborn core inflation could also dampen holiday travel this season. It reminds me of the 2023 season, and I can see ABNB re-testing its 2025 lows.
- ABNB Entry Level: Between 135.20 and 140.64
- ABNB Take Profit: Between 99.88 and 109.79
- ABNB Stop Loss: Between 148.64 and 152.30
- Risk/Reward Ratio: 2.63
Ready to trade our free signals? Here is our list of the best stock trading platforms worth checking out.
