Bearish view
- Sell the EUR/USD pair and set a take-profit at 1.1575.
- Add a stop-loss at 1.1850.
- Timeline: 1-2 days.
Bullish view
- Buy the EUR/USD pair and set a take-profit at 1.1850.
- Add a stop-loss at 1.1575.

The EUR/USD exchange rate pulled back to the important support level at 1.1700 as traders waited for the upcoming US inflation data and after Donald Trump threatened a big tariff on European goods as trade talks drag on.
EU Tariffs and US Inflation Data
The EUR/USD exchange rate pulled back after Donald Trump threatened to implement a 30% tariff on European goods entering the United States on August 1 if the two sides will not have reached an agreement.
Such a move, while better than the 50% tariff he threatened in May, is still much higher than where it is today. It woul also push the European Union to retaliate by adding new tariffs of its own, a move that would disrupt a trade relationship worth trillions.
Still, there is a hope that Trump is using the tariff threat as a bargaining approach. Besides, media reports suggest that the EU has made numerous compromises to appease the US.
The next key catalysts for the EUR/USD pair will come out on Wednesday when the Bureau of Labor Statistics (BLS) will publish the latest Consumer Price Index (CPI) data.
Economists expect the data to show that the headline CPI moved from 2.4% in May to 2.5% in June, the second month of consecutive gains. Core inflation, which excludes the volatile food and energy prices, is expected to remain unchanged at 2.8%.
A higher-than-expected inflation report means that the Federal Reserve will not cut interest rates as fast as Trump expects. On the positive side, the closely-watched inflation expectation report released last week showed that the figure fell to pre-tariff levels.
EUR/USD Technical Analysis
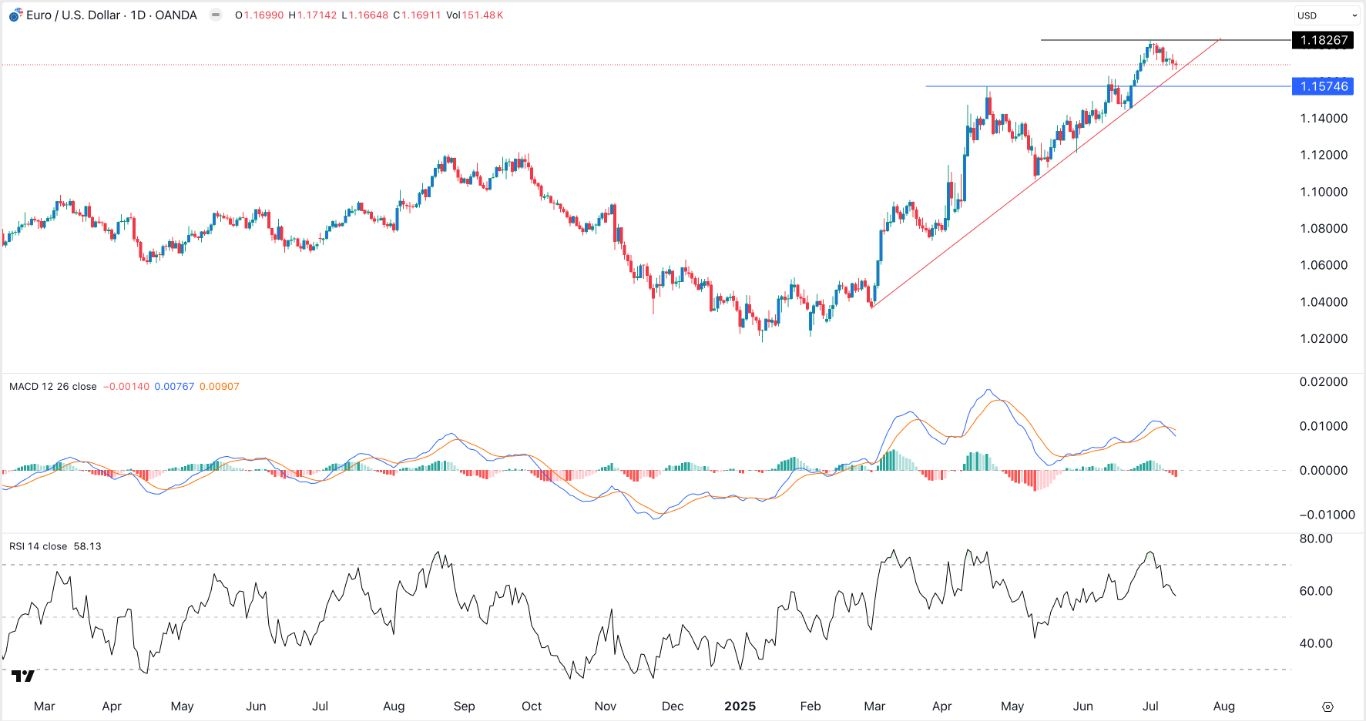
The daily chart shows that the EUR/USD exchange rate has pulled back in the past few days, moving from the year-to-date high of 1.1826 to 1.1690 today.
This price coincides with the ascending trendline that connects the lowest swings since February 28. The Relative Strength Index (RSI) has pointed downwards and is nearing the neutral point at 50. Similarly, the two lnes of th MACD have formed a bearish crossover.
Therefore, the pair will likely continue falling as sellers target the key support at 1.1575, the highest point on April 21. Moving to that level will be a break-and-retest pattern, which will lead to more upside. A drop below the support will point to more downside.
Ready to trade our daily Forex signals? Here’s a list of some of the best Forex trading platforms to check out.
Crispus Nyaga is a financial analyst, coach, and trader with more than 8 years in the industry. He has worked for leading companies like ATFX, easyMarkets, and OctaFx. Further, he has published widely in platforms like SeekingAlpha, Investing Cube, Capital.com, and Invezz. In his free time, he likes watching golf and spending time with his wife and child.
