Long-term growth potential faces short-term capital issues, which creates an interesting trade. Should investors focus on the longer-term green energy push or short-term capital-intensive investments?
Short Trade Idea
Enter your short position between 301.37 (yesterday’s intra-day low) and 313.89 (the intra-day low of its last bullish candlestick).
Market Index Analysis
- Constellation Energy (CEG) is a member of the NASDAQ 100 and the S&P 500.
- Both indices remain near record highs with rising bearish trading volumes.
- The Bull Bear Power Indicator of the S&P 500 shows a negative divergence.
Market Sentiment Analysis
Equity markets experienced a volatile session yesterday amid conflicting reports that US President Trump would fire US Federal Reserve Chair Powell. The House of Representatives passed three cryptocurrency bills in a record-setting vote, while President Trump announced that 150 countries would receive notices of tariffs ranging from 10% to 15%. He also softened his stance on China to secure a summit with President Xi Jinping. Futures are lower this morning, and investors should expect ongoing volatility.
Constellation Energy Fundamental Analysis
Constellation Energy is the largest nuclear power generator and a leading energy company in the US. It is also at the forefront of powering data centers for AI companies and is a leading player in the green energy revolution.
So, why am I bearish on CEG despite its solid long-term potential?
Constellation Energy must invest heavily to meet its ambitious goals. The appetite for data centers powering AI-based companies will drive demand. Still, the short-term capital outflows could overshadow the long-term potential. Valuations are high, revenue growth is decreasing, and CEG is destroying shareholder value as it acquires and invests in its business. The next earnings release could deliver a bearish catalyst for a correction amid a murky outlook.
|
Metric |
Value |
Verdict |
|
PE Ratio |
32.48 |
Bearish |
|
PB Ratio |
7.46 |
Bearish |
|
PEG Ratio |
1.25 |
Bullish |
|
Current Ratio |
1.47 |
Bearish |
|
ROIC-WACC Ratio |
Negative |
Bearish |
Constellation Energy Fundamental Analysis Snapshot
The price-to-earning (PE) ratio of 32.48 makes CEG an expensive stock. By comparison, the PE ratio for the S&P 500 is 28.81.
The average analyst price target for CEG is 312.12. It suggests fully valued shares by this metri,c with limited upside potential.
Constellation Energy Technical Analysis
Today’s CEG Signal

Constellation Energy Price Chart
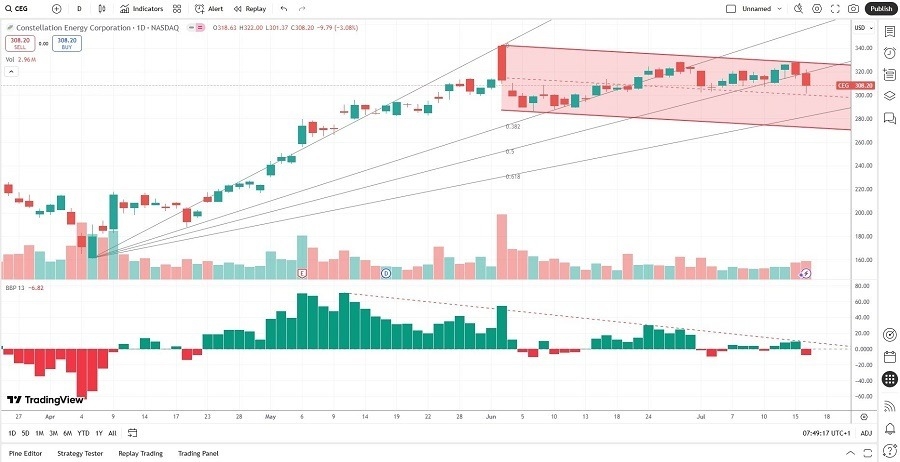
- The CEG D1 chart shows a bearish price channel, which could lead price action lower.
- It also shows a breakdown below its ascending 50.0% Fibonacci Retracement Fan.
- The Bull Bear Power Indicator is bearish and has been so since decreasing since May.
- The average trading volumes are higher during selloffs.
- CEG corrected as the S&P 500 rallied to fresh highs, a significant bearish development.
My Call
I am taking a short position in CEG between 301.37 and 313.89. Volatility may increase, but I think the bearish price channel will lead price action lower following the breakdown below its ascending 50.0% Fibonacci Retracement Fan.
- CEG Entry Level: Between 301.37 and 313.89
- CEG Take Profit: Between 188.01 and 217.90
- CEG Stop Loss: Between 327.99 and 342.00
- Risk/Reward Ratio: 4.25
Ready to trade our daily signals? Here is our list of the best broker for trading worth checking out.
