Inflationary pressures remain elevated, oil prices are relatively low, and the global economy sputters along. What about energy stocks and their performance moving forward? Get a shortlist of undervalued energy stocks with three stock picks.
Why Consider Energy Stocks for Your Portfolio?
Three reasons you should consider adding a few energy stocks to your portfolio:
- Low correlation to other asset classes for portfolio diversification.
- High-quality inflation hedge, as energy stocks benefit from higher oil prices.
- Attractive yields due to above-average dividend payments for long-term dividend portfolios.
Energy stocks now offering a quality value proposition:
- Schlumberger (SLB)
- Halliburton (HAL)
- Occidental Petroleum (OXY)
- ExxonMobil (XOM)
- Devon Energy (DVN)
- Weatherford International (WFRD)
- ConocoPhillips (COP)
- NOV (NOV)
- ONEOK (OKE)
- HF Sinclair (DINO)
- Energy Transfer (ET)
Schlumberger Fundamental Analysis
Schlumberger (SLB) is a global multinational oilfield services company and a component of the S&P 500 Index. It is the largest offshore drilling company and the largest offshore drilling contractor (by revenue). It just announced the completion of the acquisition of ChampionX (CHX).
So, why am I bullish on SLB despite its recent weakness?
SLB has the size to weather any storm and has done just that for nearly a century. It has high-value assets and reserves and will play a critical role in the clean energy transition. It also pays a nice dividend.
|
Metric |
Value |
Verdict |
|
PE Ratio |
11.89 |
Bullish |
|
PB Ratio |
2.43 |
Bullish |
|
PEG Ratio |
3.48 |
Bearish |
|
Current Ratio |
1.24 |
Bearish |
|
Return on Assets |
8.55% |
Bullish |
|
Return on Equity |
21.47% |
Bullish |
|
Profit Margin |
11.62% |
Bullish |
|
ROIC-WACC Ratio |
Positive |
Bullish |
|
Dividend Yield |
3.11% |
Bullish |
Schlumberger Fundamental Analysis Snapshot
The price-to-earnings (PE) ratio of 11.89 makes SLB an inexpensive stock. By comparison, the PE ratio for the S&P 500 is 28.81.
The average analyst price target for SLB is 47.12. This suggests plenty of upside potential.
Schlumberger Technical Analysis

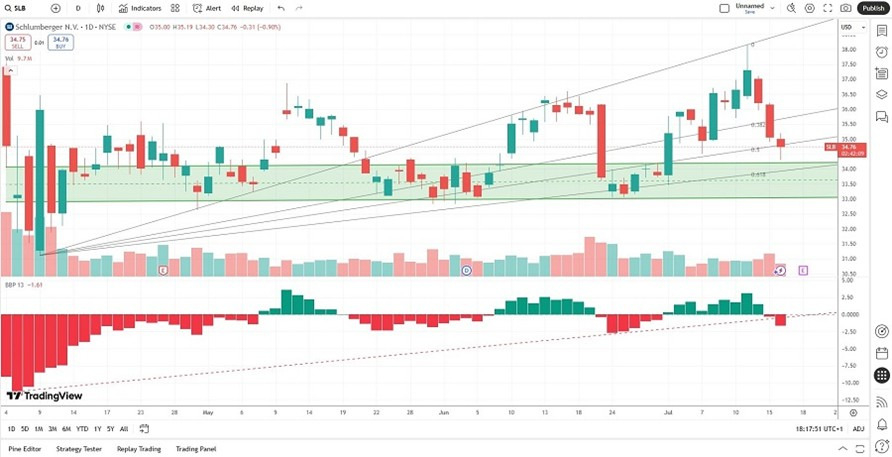
Schlumberger Price Chart
- The SLB D1 chart shows price action at its ascending 50.0% Fibonacci Retracement Fan.
- It also shows SLB at a massive horizontal support zone.
- The Bull Bear Power Indicator turned bearish but is within its ascending trendline.
My Call on Schlumberger
I am taking a long position in SLB between 34.30 and 35.19. Oil price volatility will be background noise. I am buying SLB based on its natural gas portfolio, extraction data from mature wells, and the role I expect it to play in the energy transition. The dividend yield is a bonus, and I will buy SLB on future dips.
Halliburton Fundamental Analysis
Halliburton (HAL) is a global multinational company, the second-largest oilfield services company, and a component of the S&P 500. It has hundreds of subsidiaries and over 55,000 employees. HAL is also responsible for most global fracking operations.
So, why am I bullish on HAL despite its recent weakness?
US President Trump has made oil and gas essential to US energy security, and HAL is best-positioned to extract hard-to-reach oil reserves. It is also a well-diversified conglomerate that provides a buffer against oil price volatility.
|
Metric |
Value |
Verdict |
|
PE Ratio |
8.92 |
Bullish |
|
PB Ratio |
1.77 |
Bullish |
|
PEG Ratio |
11.91 |
Bearish |
|
Current Ratio |
1.98 |
Bullish |
|
Return on Assets |
8.34% |
Bullish |
|
Return on Equity |
20.25% |
Bullish |
|
Profit Margin |
9.31% |
Bullish |
|
ROIC-WACC Ratio |
Positive |
Bullish |
|
Dividend Yield |
3.07% |
Bullish |
Halliburton Fundamental Analysis Snapshot
The price-to-earning (PE) ratio of 8.92 makes HAL an inexpensive stock. By comparison, the PE ratio for the S&P 500 is 28.81.
The average analyst price target for HAL is 28.89. It suggests plenty of upside potential.
Halliburton Technical Analysis

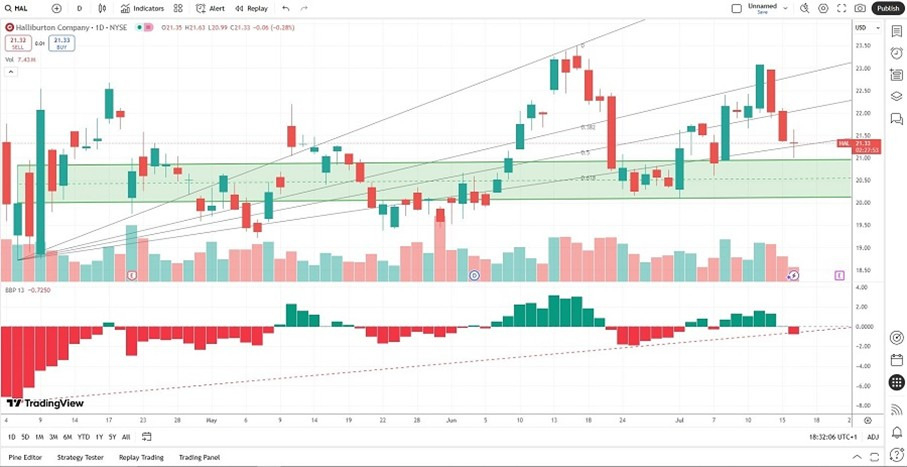
Halliburton Price Chart
- The HAL D1 chart shows price action at its ascending 50.0% Fibonacci Retracement Fan.
- It also shows HAL at a massive horizontal support zone.
- The Bull Bear Power Indicator turned bearish but is within its ascending trendline.
My Call on Halliburton
I am taking a long position in HAL between 20.99 and 21.63. The well-diversified nature of this energy-forward conglomerate provides a buffer few energy stocks have, and its position as a leader in fracking and the US energy security make it an ideal buy-the-dip candidate with a decent dividend yield.
Occidental Petroleum Fundamental Analysis
Occidental Petroleum (OXY) is a hydro exploration and petrochemical company and a component of the S&P 500. It is unafraid to acquire assets to ensure its market position and diversify its assets. OXY is also at the forefront of investing in the cleaner extraction of fossil fuels.
So, why am I bullish on OXY despite its recent weakness?
OXY does not stack up as well as the above two picks. Still, its approach to cleaner extraction and its PEG ratio made it the energy company with the most underappreciated future potential. I also appreciate its diversified assets in underdeveloped regions, which have massive upside potential.
|
Metric |
Value |
Verdict |
|
PE Ratio |
17.27 |
Bullish |
|
PB Ratio |
1.59 |
Bullish |
|
PEG Ratio |
1.27 |
Bullish |
|
Current Ratio |
1.01 |
Bearish |
|
Return on Assets |
2.84% |
Bearish |
|
Return on Equity |
6.94% |
Bearish |
|
Profit Margin |
8.75% |
Bullish |
|
ROIC-WACC Ratio |
Positive |
Bullish |
|
Dividend Yield |
2.09% |
Bearish |
Occidental Petroleum Fundamental Analysis Snapshot
The price-to-earnings (PE) ratio of 17.27 makes OXY an inexpensive stock. By comparison, the PE ratio for the S&P 500 is 28.81.
The average analyst price target for OXY is 50.08. It suggests decent upside potential.
Occidental Petroleum Technical Analysis

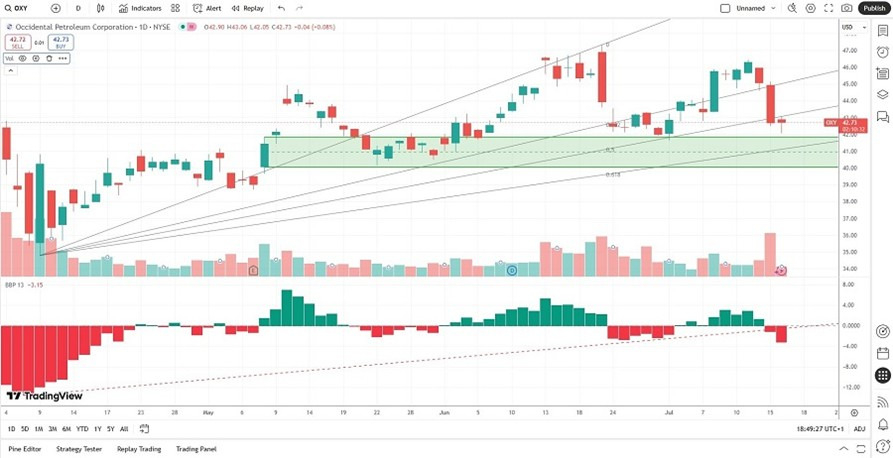
Occidental Petroleum Price Chart
- The OXY D1 chart shows price action between its ascending 50.0% and 61.8% Fibonacci Retracement Fan.
- It also shows OXY just above a massive horizontal support zone.
- The Bull Bear Power Indicator turned bearish but is within its ascending trendline.
My Call on Occidental Petroleum
I am taking a long position in OXY between 42.05 and 43.06. I am slightly worried about its balance sheet, but OXY ranks among the energy stocks with excellent potential on a five-year outlook. Its ongoing investments in reducing its carbon footprint are among the best in the industry, and I will cautiously buy the dip.
Ready to trade our analysis of the best energy stocks to buy? Here is our list of the best brokers for trading worth checking out.
