While there is no universal definition, small-cap stocks usually refer to publicly listed companies with market values between $250 million and $2 billion. The “cap” is short for market capitalization, which is the number of shares multiplied by the share price.
Here is an example:
- Company XY2 has 50 million shares, and each share trades at $10
- Therefore, the market cap is $500,000,000 (50 million x $10)
The Russell 2000 equity index is the primary small-cap index. It covers 2,000 small-caps with market values between $240 million and $6 billion. Some would argue that a few components of the Russell 2000 are mid-cap stocks, as the equity bull market has technically lifted them out of small-cap territory. Other small-cap indices are the S&P SmallCap 600 and the MSCI USA Small-Cap Index.
The Financial Industry Regulatory Authority (FINRA) has the following definition of small-cap, medium-cap, and large-cap stocks:
- Small-cap stocks have a market cap of $250 million to $2 billion
- Mid-cap stocks have a market cap above $2 billion but below $10 billion
- Large-cap stocks have a market cap exceeding $10 billion
Small-cap stocks offer exciting stories, disruptive technologies and services, portfolio diversification, and can deliver above-average growth, but investors must accept higher risks.
Here are a few things to consider when evaluating small-cap stocks:
- Look for companies with a product or service in a high-growth sector with a disruptive advantage
- Favor small-caps with annualized EPS growth of 25% or more
- Ensure the current price trades at a discount to the average analyst price target
- Buy small-cap stocks in a separate portfolio and do not mix them with other investments
Investing in small-cap stocks carries greater risks due to unknown factors, shaky balance sheets, and challenging business conditions. After all, there is a reason why small-caps are small-caps. Investors must also accept greater volatility.
Here is a shortlist of small-cap stocks that reported at least a 25% EPS growth over the past twelve months and a market cap below $2 billion:
- Altice USA (ATUS)
- JetBlue Airways (JBLU)
- Companhia Siderúrgica Nacional (SID)
- Kosmos Energy (KOS)
- Dole (DOLE)
- Atea Pharmaceuticals (AVIR)
- Lithium Americas (LAC)
- Sonos (SONO)
- Vimeo (VMEO)
- GoPro (GPRO)
- Butterfly Network (BFLY)
- AbCellera Biologics (ABCL)
- Chegg (CHGG)
- Paramount Group (PGRE)
- Bumble (BMBL)
- Brandywine Realty (BDN)
- DigitalBridge Group (DBRG)
- Sunstone Hotel Investors (SHO)
- Teradata Corporation (TDC)
- Chimera Investment Corporation (CIM)
- Steelcase (SCS)
DigitalBridge Group (DBRG) is an alternative asset manager and global digital infrastructure investment firm managing over $106 billion of infrastructure assets on behalf of its limited partners and shareholders. It has over 30 years of experience, more than 45 companies in its portfolio, and has positioned itself at the forefront of the AI and data center boom. It is also a member of the Russell 2000.
So, why am I bullish on DigitalBridge Group despite its latest earnings miss?
I believe the joint acquisition of Yondr Group, a global developer, owner, and operator of hyperscale data centers, will provide a significant boost to DBRG. The valuations are decent, and I like the P/B ratio. Despite the earnings miss, the share price moved higher, another sign of confidence. With an investment portfolio that caters to AI and digital infrastructure, I believe the outlook for DBRG is bright.
|
Metric |
Value |
Verdict |
|
P/E Ratio |
26.90 |
Bullish |
|
P/B Ratio |
1.59 |
Bullish |
|
PEG Ratio |
Unavailable |
Bearish |
|
Current Ratio |
0.72 |
Bearish |
|
Return on Assets |
0.31% |
Bearish |
|
Return on Equity |
0.55% |
Bearish |
|
Profit Margin |
1.65% |
Bearish |
|
ROIC-WACC Ratio |
Unavailable |
Bearish |
|
Dividend Yield |
0.38% |
Bearish |
The price-to-earnings (P/E) ratio of 26.90 makes DBRG a reasonably valued stock. By comparison, the P/E ratio for the Russell 2000 is 32.72.
The average analyst price target for DigitalBridge Group is 16.72. It suggests excellent upside potential from current levels.

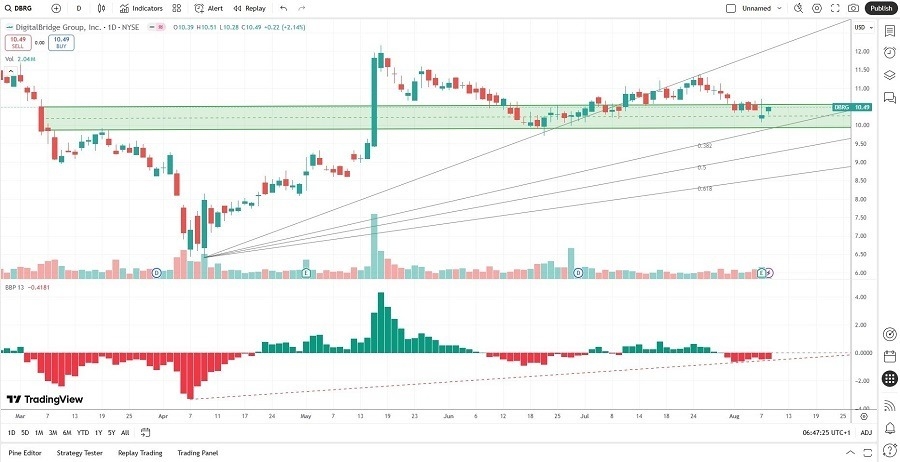
- The DBRG D1 chart shows price action between its ascending 0.0% and 38.2% Fibonacci Retracement Fan
- It also shows DigitalBridge Group trading inside of a horizontal resistance zone
- The Bull Bear Power Indicator turned bearish, but has been trending higher over the past few trading sessions with the potential for a bullish crossover
I am taking a long position in DigitalBridge Group between 9.06 and 9.84. The valuation for an AI and data center stock is among the lower ones, the investment portfolio is promising, and the share price was unfazed by the latest earnings miss. Therefore, I will buy the dip.
Teradata Corporation (TDC) is a software company offering cloud database and analytics-related software, products, and services. It assists data centers and the AI sector. TDC is also a component of the S&P 600.
So, why am I bullish on TDC despite its latest share price struggles?
The hybrid data analytics for AI ensures flexible pricing, which should assist smaller players in the AI space. The valuation is an attractive entry opportunity, and the return on equity is excellent. While TDC has faced struggles over the past month, I think the Vantage cloud analytics software should continue to drive growth.
|
Metric |
Value |
Verdict |
|
P/E Ratio |
18.17 |
Bullish |
|
P/B Ratio |
11.02 |
Bearish |
|
PEG Ratio |
3.35 |
Bearish |
|
Current Ratio |
0.84 |
Bearish |
|
Return on Assets |
7.88% |
Bullish |
|
Return on Equity |
87.34% |
Bullish |
|
Profit Margin |
8.10% |
Bullish |
|
ROIC-WACC Ratio |
Positive |
Bullish |
|
Dividend Yield |
0.00% |
Bearish |
The price-to-earnings (P/E) ratio of 18.17 makes TDC an inexpensive stock. By comparison, the P/E ratio for the S&P 600 is 35.17.
The average analyst price target for TDC is 24.44. It suggests decent upside potential for this small-cap AI support company.
Teradata Corporation Technical Analysis

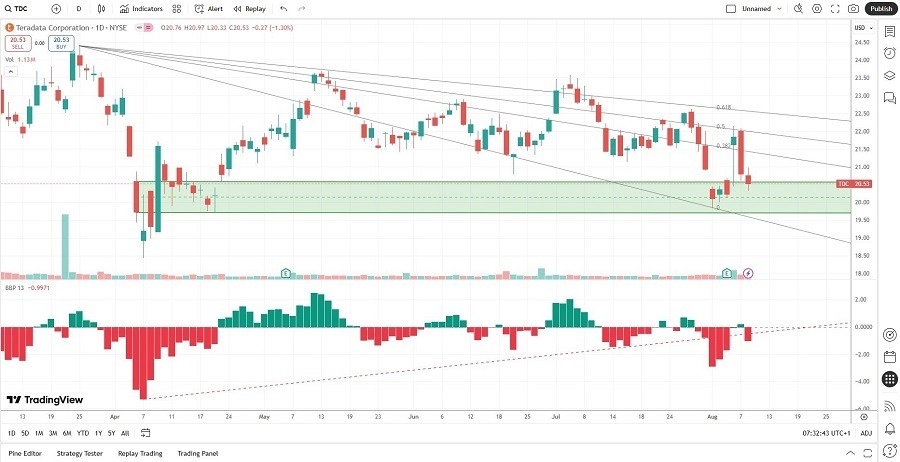
- The TDC D1 chart shows price action at a solid horizontal support zone.
- The average trading volumes during bullish days are notably higher than during bearish days.
- The Bull Bear Power Indicator is bearish, but within its ascending trendline, and has traded between bullish and bearish conditions over the past two weeks
I am taking a long position in TDC between 20.15 and 20.97. The low valuations, return on equity, and AI-focused big data analytics should provide sufficient upside potential to push this small-cap towards its average analyst price target.
Ready to trade our analysis of the best small-cap stocks to buy now? Here is our list of the best brokers for trading worth checking out.
