Bullish view
- Buy the GBP/USD pair and set a take-profit at 1.3675.
- Add a stop-loss at 1.3425.
- Timeline: 1-2 days.
Bearish view
- Sell the GBP/USD pair and set a take-profit at 1.3425.
- Add a stop-loss at 1.3675.

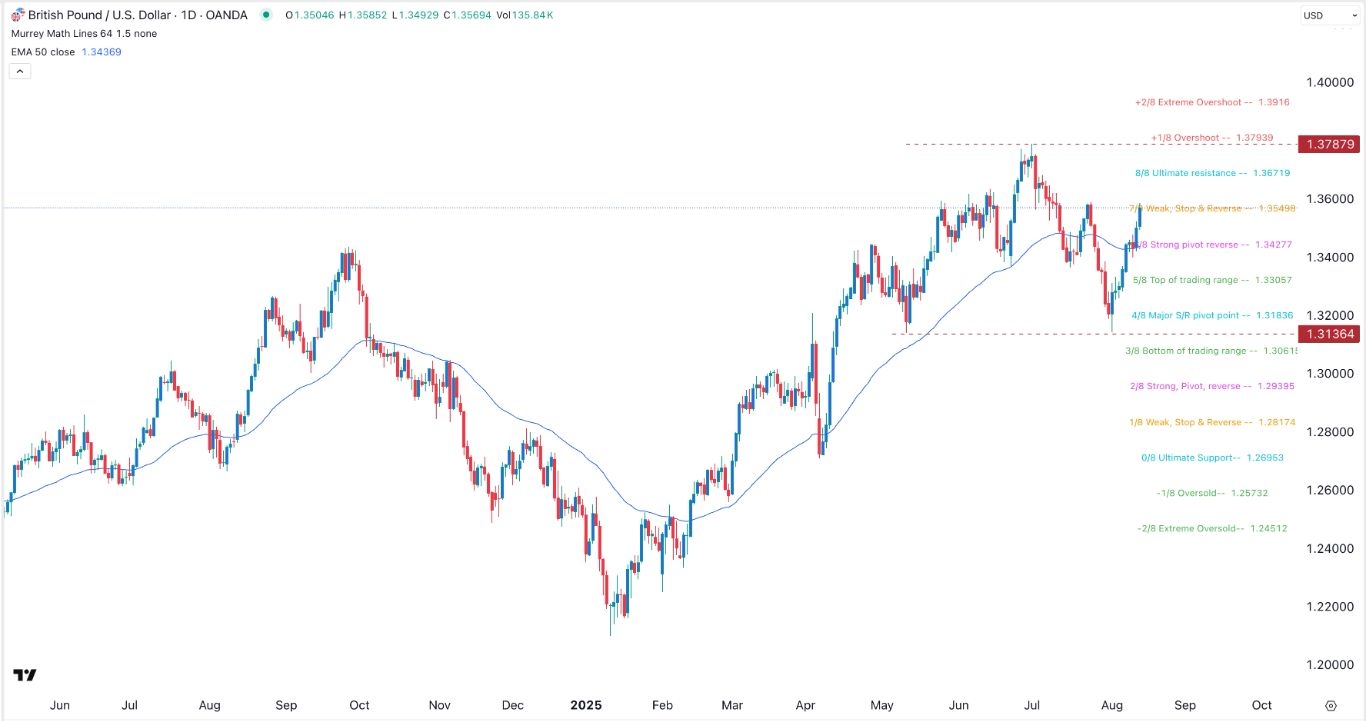
The GBP/USD pair’s rally gained steam as bulls targeted the year-to-date high amid sustained weakness in the US dollar. The pair soared to a high of 1.3568 on Thursday morning, up from this month’s low of 1.3135.
UK GDP Data Ahead
The GBP/USD exchange rate rose as traders waited for the upcoming UK macro data. Economists expect the preliminary data to show that the British economy slowed down in Q2, confirming that it is in stagflation.
The average estimate is that the economy expanded by 0.1% in Q1, a slowdown from the previous quarter’s growth of 0.7%. The annual inflation is expected to come in at 1%, lower than the previous 1.3%.
If the actual numbers are accurate or lower than expected, it means that the UK is in a stagflation, which is characterized by slow growth and high inflation. A recent report showed that the country’s inflation rose to 3.6% in June, much higher than the Bank of England’s target of 2.0%.
Stagflation is one of the most challenging issues for a central bank to address, which explains why the BoE was highly divided in its meeting last week.
In a stagflation, the bank has to choose one option at the expense of the other. In this, it can decide to cut rates to stimulate the economy and risk high inflationary pressures.
The GBP/USD pair is also reacting to the rising odds that the Federal Reserve will cut interest rates in September after the weak non-farm payroll numbers that forced Donald Trump to fire the head of the Bureau of Labor Statistics.
The US then published its inflation report this week, which showed that inflation rose at a lower pace than expected. The headline CPI remained unchanged at 2.7%, while the core figure rose to 3.1%.
GBP/USD Technical Analysis
The daily chart shows that the GBP/USD exchange rate has rebounded in the past few years. It formed a double-bottom pattern at 1.3135, its lowest point in May and this month. This pattern’s neckline is at 1.3787, its highest level on July 1.
The pair has moved to the weak, stop & reverse point of the Murrey Math Lines and is slightly above the 50-day and 100-day moving averages. Therefore, the pair will likely keep rising as bulls target the ultimate resistance at 1.3670.
Ready to trade our free trading signals? We’ve made a list of the best UK forex brokers worth using.
Crispus Nyaga is a financial analyst, coach, and trader with more than 8 years in the industry. He has worked for leading companies like ATFX, easyMarkets, and OctaFx. Further, he has published widely in platforms like SeekingAlpha, Investing Cube, Capital.com, and Invezz. In his free time, he likes watching golf and spending time with his wife and child.
