Short Trade Idea
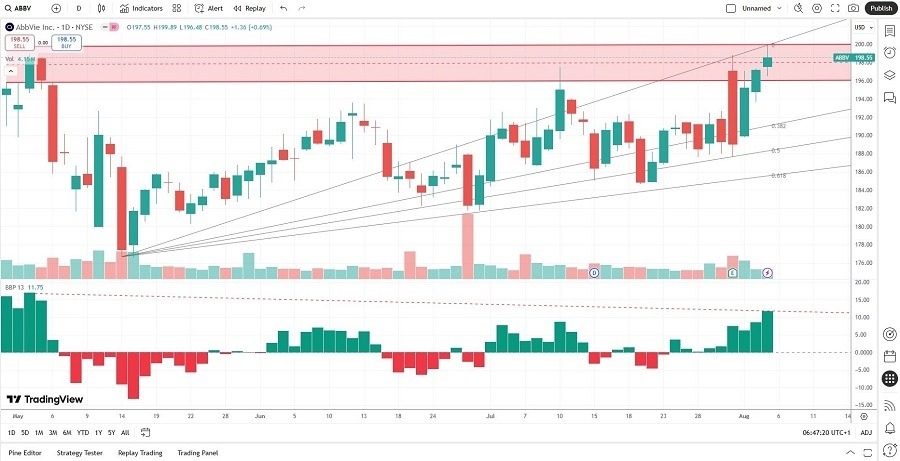
Enter your short position between 195.82 (the lower band of its horizontal resistance zone) and 199.89 (yesterday’s intra-day high).
Market Index Analysis
- AbbVie (ABBV) is a member of the S&P 100 and the S&P 500.
- Both indices trade near their record high, but bearish trading volumes raise a red flag.
- The Bull Bear Power Indicator of the S&P 500 shows a negative divergence.
Market Sentiment Analysis
The bond market bets on three interest rate cuts after the dismal Friday’s NFP report and yesterday’s ISM services reading confirmed a standstill in the services sector, which accounts for over 70% of economic activity. Equity markets corrected, and AI darling AMD disappointed with its second-quarter earnings report, while remaining upbeat on AI. The inflation risk of tariffs is uncertain, credit card debt is at an all-time high, and the Federal Reserve faces a challenging September meeting. More volatility lies ahead in what could be a red August for equity markets.
AbbVie Fundamental Analysis
AbbVie is a pharmaceutical company that ranks seventh among the largest pharmaceutical companies by revenue, with a growing presence in neuroscience, bolstered by a robust product portfolio.
So, why am I bearish on ABBV after its recent rally?
The excessive valuation and high debt level worry me. Its active pipeline is not as deep as its core competitors, and I cannot ignore its negative earnings growth. Tariffs on pharmaceuticals and their impact on the US healthcare system are an unknown factor that could add downside pressure on AbbVie. The deteriorating technical picture could trigger a profit-taking sell-off.

AbbVie Fundamental Analysis Snapshot
The price-to-earnings (P/E) ratio of 94.55 makes ABBV an expensive stock. By comparison, the P/E ratio for the S&P 500 is 28.79.
The average analyst price target for ABBV is 214.24. It points to decent upside potential, but downside risks are greater.
AbbVie Technical Analysis
Today’s ABBV Signal

- The ABBV D1 chart shows price action has formed a double top, a bearish chart pattern.
- It also shows price action near its 0.0% Fibonacci Retracement Fan level.
- The Bull Bear Power Indicator is bullish, but with a descending trendline.
- Bearish trading volumes are notably higher than bullish trading volumes.
- ABBV pushed higher with the S&P 500, but remains exposed to a sell-off amid technical cracks in the rally.
My Call
I am taking a short position in ABBV between 195.82 and 199.89. The high valuation and debt levels have combined with a weakening technical outlook. Therefore, I believe we are in for a correction, and I will sell the rally.
- ABBV Entry Level: Between 195.82 and 199.89
- ABBV Take Profit: Between 164.39 and 168.54
- ABBV Stop Loss: Between 207.22 and 210.69
- Risk/Reward Ratio: 2.76
Ready to trade our free trading signals? We’ve made a list of the top 10 forex brokers in the world for you to check out.
