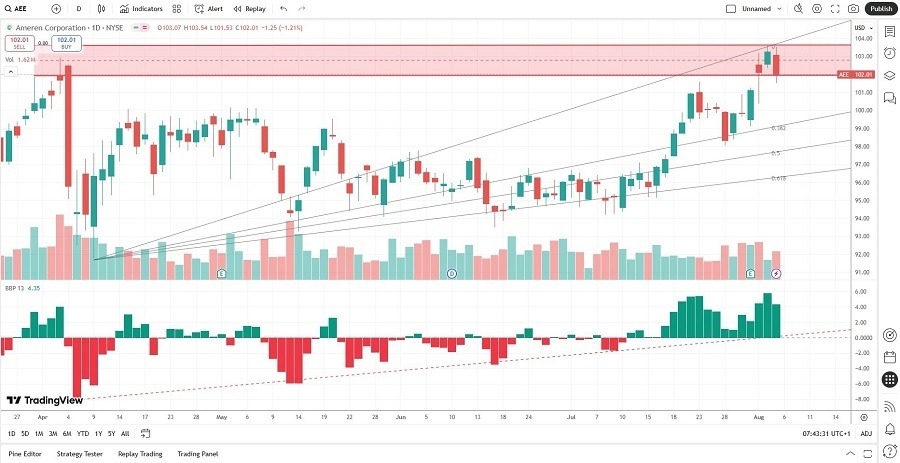
Short Trade Idea
Enter your short position between 101.53 (yesterday’s intra-day low) and 103.59 (the intra-day high of its last bullish candlestick).
Market Index Analysis
- Ameren (AEE) is a member of the S&P 500.
- This index trades near its record high, but bearish trading volumes raise a red flag.
- The Bull Bear Power Indicator of the S&P 500 shows a negative divergence.
Market Sentiment Analysis
The bond market bets on three interest rate cuts after the dismal Friday’s NFP report and yesterday’s ISM services reading confirmed a standstill in the services sector, which accounts for over 70% of economic activity. Equity markets corrected, and AI darling AMD disappointed with its second-quarter earnings report, while remaining upbeat on AI. The inflation risk of tariffs is uncertain, credit card debt is at an all-time high, and the Federal Reserve faces a challenging September meeting. More volatility lies ahead in what could be a red August for equity markets.
Ameren Fundamental Analysis
Ameren is a utility company with 2.4 million electric customers and 900,000 natural gas customers. It also owns the Bagnell Dam.
So, why am I bearish on AEE despite its price spike?
The fundamental picture does not support current valuations. High debt levels and low operating margins stand out, but Ameren is destroying shareholder value amid an alarming return on invested capital. While I admire its support for electric vehicles and charging stations, I am selling AEE until it can get a grip on its balance sheet issues.

Ameren Fundamental Analysis Snapshot
The price-to-earnings (P/E) ratio of 22.42 makes AEE an expensive stock for a utility. By comparison, the P/E ratio for the S&P 500 is 28.79.
The average analyst price target for AEE is 105.93. It suggests limited upside potential, while downside risks are rising.
Ameren Technical Analysis
Today’s AEE Signal

- The AEE D1 chart shows price action has formed a double top, a bearish chart pattern.
- It also shows price action near its 0.0% Fibonacci Retracement Fan level.
- The Bull Bear Power Indicator is bullish, but failed to confirm its most recent price spike.
- Bearish trading volumes are higher than bullish trading volumes.
- AEE pushed higher with the S&P 500, but remains exposed to a sell-off amid technical cracks in the rally.
My Call
I am taking a short position in AEE between 101.53 and 103.59. The value destruction and return on invested capital do not support the current share price, which remains near full value based on average analyst estimates. Therefore, this price spike presents a good selling opportunity.
- AEE Entry Level: Between 101.53 and 103.59
- AEE Take Profit: Between 91.77 and 93.50
- AEE Stop Loss: Between 106.18 and 109.37
- Risk/Reward Ratio: 2.10
Ready to trade our daily Forex signals? Here’s a list of some of the best Forex trading platforms to check out.
