Market Index Analysis
- Amazon.com (AMZN) is a member of the NASDAQ 100, the Dow Jones Industrial Average, the S&P 100, and the S&P 500.
- All four indices are at or near record highs but underlying technical factors and emerging chart patterns hint at a potential short-term reversal.
- The Bull Bear Power Indicator of the NASDAQ 100 shows a negative divergence, and half of a reversal chart pattern has formed.
Market Sentiment Analysis
Today concludes the holiday-shortened trading week, and traders eagerly await the June NFP report, especially after yesterday’s ADP report showed an unexpected job loss of 33K. It counters some trade optimism after the US rescinded export restrictions on chip design software to China amid ongoing trade talks. China lifted export restrictions on select rare earth exports to the US. President Trump’s Megabill remains stuck in the House of Representatives for now, as Republicans lack the votes to pass it. Volatility could dominate today’s trading session.
Amazon.com Fundamental Analysis
Amazon.com is one of the Big Five US technology companies and a leader in the global AI race and cloud computing sector. It has excellent profit margins, but its debt remains excessive. AMZN is an industry disruptor but faces stiff competition from China.
So, why am I bearish on AMZN following an impressive second-quarter performance?
While AMZN has solid long-term potential, the current headwinds combine for a bearish cloud that Amazon.com is unlikely to escape. AI, cloud computing, and retail competition from China diminish its global sales outlook outside core US allies. Former CEO Jeff Bezos continues to offload shares, AMZN increases its share count, and high interest rates threaten its balance sheet stability.

The price-to-earning (PE) ratio of 35.82 makes AMZN a relatively cheap tech stock. By comparison, the PE ratio for the NASDAQ 100 is 40.11.
The average analyst price target for AMZN is 241.82, which suggests marginal upside potential. My analysis concludes that AMZN is unlikely to push much higher than that.
Amazon.com Technical Analysis
Today’s AMZN Signal

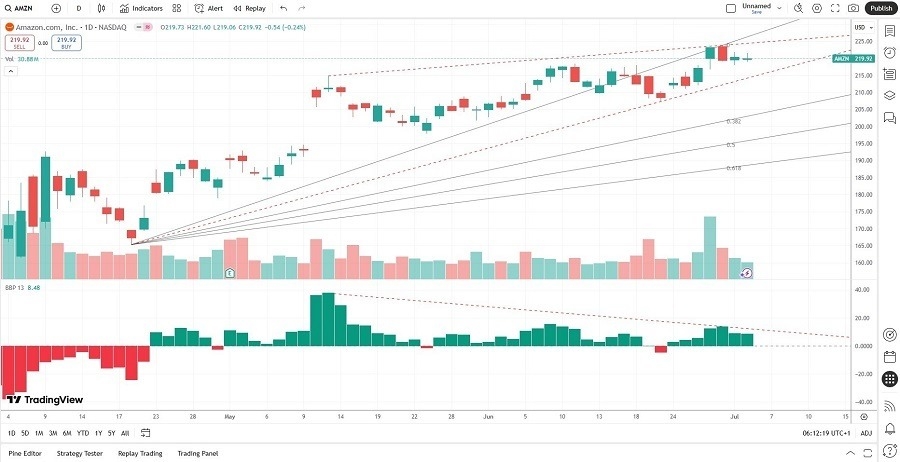
AMZN Price Chart
- The AMZN D1 chart shows a narrow rising wedge, a bearish chart pattern.
- It also shows half of a head-and-shoulders formation, a reversal pattern
- The Bull Bear Power Indicator is bullish but shows negative divergence.
- Trading volumes have contracted during the last two bullish candles.
- The last four candlesticks show bearish patterns at resistance levels.
Short Trade Idea
Enter your short position between 216.74 (the lower of a hammer candlestick marking resistance) and 223.82 (its most recent intra-day high).
My Call
I am taking a short position in AMZN between 216.74 and 223.82. I consider the short-term upside potential limited, but I will keep my stop-loss levels tight on this trade. AMZN has long-term upside potential, but the short-term bearish signs outweigh it. A technical correction is likely to take AMZN into solid support levels.
- AMZN Entry Level: Between 216.74 and 223.82
- AMZN Take Profit: Between 192.88 and 197.85
- AMZN Stop Loss: Between 225.86 and 241.82
- Risk/Reward Ratio: 2.62
Ready to trade our daily signals? Here is our list of the best stock trading platforms worth checking out.
