- Australia will release its Inflation Expectations for June on Thursday, which could shift interest rate bets.
- The United States will release the US Producer Price Index data for May, providing insight into wholesale inflation pressures.
- AUD/USD remains vulnerable to these macroeconomic data releases, which continue to drive rate expectations and consumer sentiment.
The Australian Dollar (AUD) is trading lower against the US Dollar (USD) on Wednesday, erasing earlier gains following the progress in US-China trade talks.
With AUD/USD prices remaining above the 0.6500 psychological level of support at the time of writing, inflation data could continue to drive prices on Thursday.
Australia Inflation Expectations and US PPI could take focus
On Thursday, Australia will release its Consumer Inflation Expectations for June, which reflect consumers’ expectations of future inflation over the next 12 months.
The focus will be on whether these expectations have changed from the 4.1% reading in May. In the United States, Initial Jobless Claims are expected to rise to 240,000 over the past week, following a reading of 247,000 last week.
Additionally, markets will be closely watching the release of the US Producer Price Index (PPI) for May, which measures inflation at the wholesale level. The monthly PPI rate for May is expected to increase to 0.2%, following a contraction of 0.5% in April.
The annual PPI rate is projected to rise to 2.6%, up from 2.4% in the previous month. During the same period, the annual core PPI inflation rate, which excludes the more volatile food and energy prices, is expected to remain steady at 3.1%.
On Wednesday, the Consumer Price Index (CPI) for May showed a surprising decline, with both monthly and annual figures falling below expectations. These results are likely to influence market expectations regarding the Federal Reserve’s (Fed) policy direction.
AUD/USD trades below 0.6500
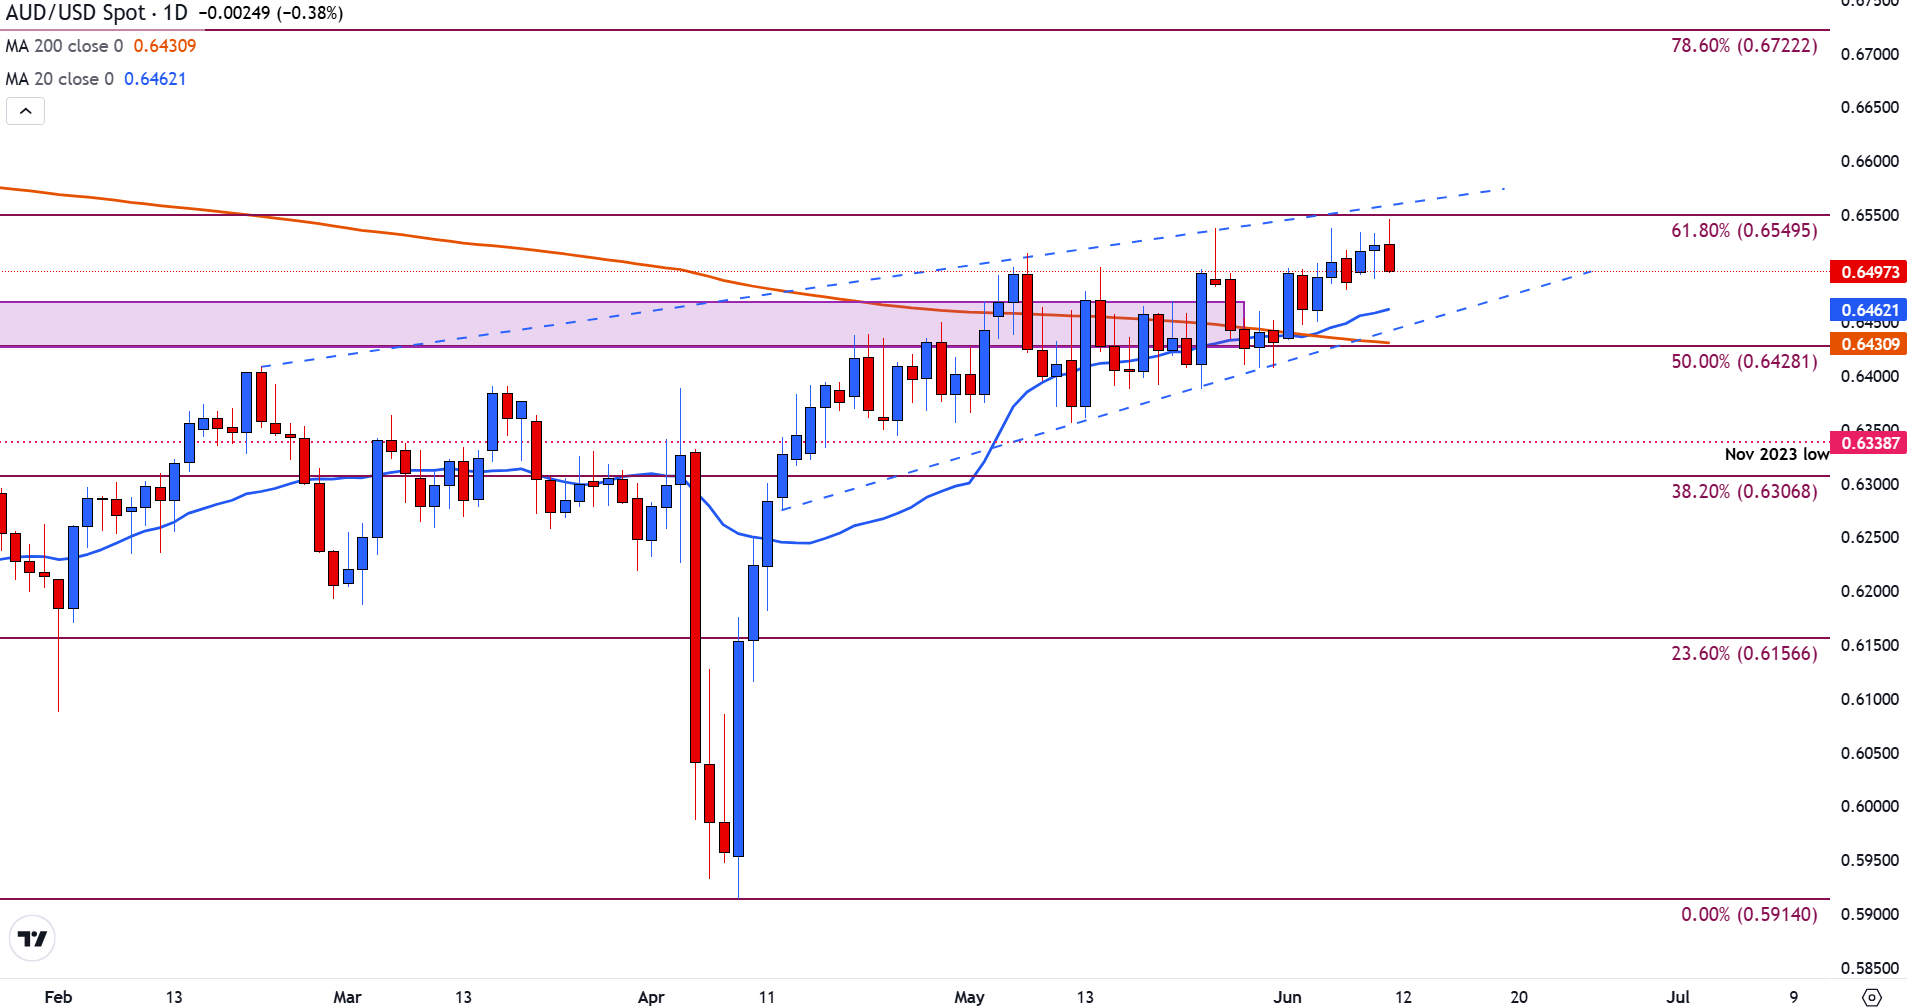
The AUD/USD pair is currently trading below the 61.8% Fibonacci retracement level of the decline from September to April, which is around 0.6549. The pair has edged below 0.6500 at the time of writing.
The 20-day Simple Moving Average (SMA) has consistently acted as dynamic support, helping to maintain the short-term trend near 0.6463.
On the other hand, the 200-day SMA, presently near 0.6430, stands as a significant medium-term support level.
AUD/USD daily chart

A decisive break above 0.6545 could open the path for a movement toward 0.6722, which corresponds to the 78.6% Fibonacci retracement.
Conversely, a breakdown from the current wedge pattern could lead to a retracement toward 0.6428 (the 50% Fibonacci level) or even the November low near 0.6339.
The price action in the upcoming sessions will be crucial in determining whether the bullish momentum continues or reverses.
Economic Indicator
Consumer Inflation Expectations
The Consumer Inflation Expectation released by the Melbourne Institute presents the consumer expectations of future inflation during the next 12 months. The higher expectations, the stronger the effect they will have on a probability of a rate hike by the RBA. Therefore, a high reading should be taken as positive, or bullish, for the AUD, while a low expectations are seen as negative or bearish.
Read more.
Next release:
Thu Jun 12, 2025 01:00
Frequency:
Monthly
Consensus:
–
Previous:
4.1%
Source:
University of Melbourne
Inflation FAQs
Inflation measures the rise in the price of a representative basket of goods and services. Headline inflation is usually expressed as a percentage change on a month-on-month (MoM) and year-on-year (YoY) basis. Core inflation excludes more volatile elements such as food and fuel which can fluctuate because of geopolitical and seasonal factors. Core inflation is the figure economists focus on and is the level targeted by central banks, which are mandated to keep inflation at a manageable level, usually around 2%.
The Consumer Price Index (CPI) measures the change in prices of a basket of goods and services over a period of time. It is usually expressed as a percentage change on a month-on-month (MoM) and year-on-year (YoY) basis. Core CPI is the figure targeted by central banks as it excludes volatile food and fuel inputs. When Core CPI rises above 2% it usually results in higher interest rates and vice versa when it falls below 2%. Since higher interest rates are positive for a currency, higher inflation usually results in a stronger currency. The opposite is true when inflation falls.
Although it may seem counter-intuitive, high inflation in a country pushes up the value of its currency and vice versa for lower inflation. This is because the central bank will normally raise interest rates to combat the higher inflation, which attract more global capital inflows from investors looking for a lucrative place to park their money.
Formerly, Gold was the asset investors turned to in times of high inflation because it preserved its value, and whilst investors will often still buy Gold for its safe-haven properties in times of extreme market turmoil, this is not the case most of the time. This is because when inflation is high, central banks will put up interest rates to combat it.
Higher interest rates are negative for Gold because they increase the opportunity-cost of holding Gold vis-a-vis an interest-bearing asset or placing the money in a cash deposit account. On the flipside, lower inflation tends to be positive for Gold as it brings interest rates down, making the bright metal a more viable investment alternative.

