Bearish View
- Sell the AUD/USD pair and set a take-profit at 0.6375.
- Add a stop-loss at 0.6600.
- Timeline: 1-2 days.
Bullish view
- Buy the AUD/USD pair and set a take-profit at 0.6600.
- Add a stop-loss at 0.6375.
The AUD/USD pair is stuck in a tight range this week, likely because there are no major market-moving events from the United States and Australia. It was trading at 0.6472 on Wednesday, where it has remained in the past two days.
Australian Economy is Recovering
The AUD/USD pair wavered after a report by S&P Global said that the Australian economy was doing well. The data revealed that the services PMI rose from 51.8 in June to 54.1, a sign that the sector is expanding.
Another data point showed that the composite PMI rose from 51.6 in June to 53.8 last month. A PMI figure of 50 and above signals that a sector is growing.
More data showed that Australia’s household spending rose from 4.4% in May to 4.8% in June. This is an important report because consumer spending is a key part of the Australian economy.
The AUD/USD pair also reacted mildly to the latest US trade and PMI numbers. US exports dropped to $277 billion in June, while imports fell to $337 billion. Consequently, the trade deficit narrowed to $60.2 billion. These numbers are early indicators that Trump’s tariffs were having an impact on the economy.
A separate report revealed that the ISM services PMI eased slightly to 50.1, while the one by S&P Global revealed that the figure rose to 55.7.
There will be no important macroeconomic data from the US and Australia, meaning that the pair will likely remain in a tight range. Traders will continue watching any potential trade deal between the United States and China.
The pair will also react to statements on the Federal Reserve. For example, in a note on Tuesday, Goldman Sachs analysts estimated that the Fed would slash rates in September.
AUD/USD Technical Analysis
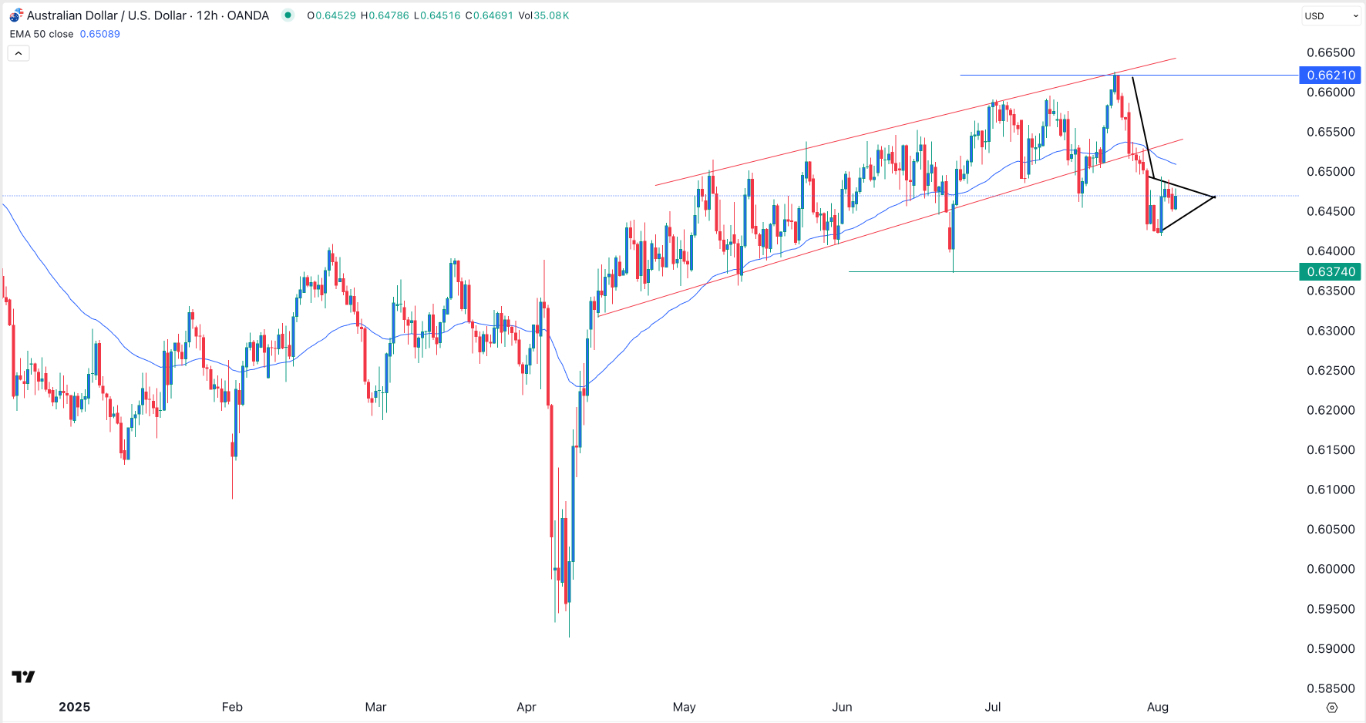
The 12-hour chart shows that the AUD/USD exchange rate has pulled back in the past few days. It moved from a high of 0.6621 on July 24 to 0.6472.
The pair has dropped below the 50-period Exponential Moving Average (EMA), a sign that bears are in control. It has moved below the lower side of the ascending channel.
There are signs that the AUD/USD pair has formed a bearish pennant pattern. Therefore, the pair will likely have a bearish breakdown, with the next point to watch being at 0.6375, its lowest point on June 23.
Ready to trade our free Forex signals? Here are the best forex platforms in Australia to choose from.
Crispus Nyaga is a financial analyst, coach, and trader with more than 8 years in the industry. He has worked for leading companies like ATFX, easyMarkets, and OctaFx. Further, he has published widely in platforms like SeekingAlpha, Investing Cube, Capital.com, and Invezz. In his free time, he likes watching golf and spending time with his wife and child.
