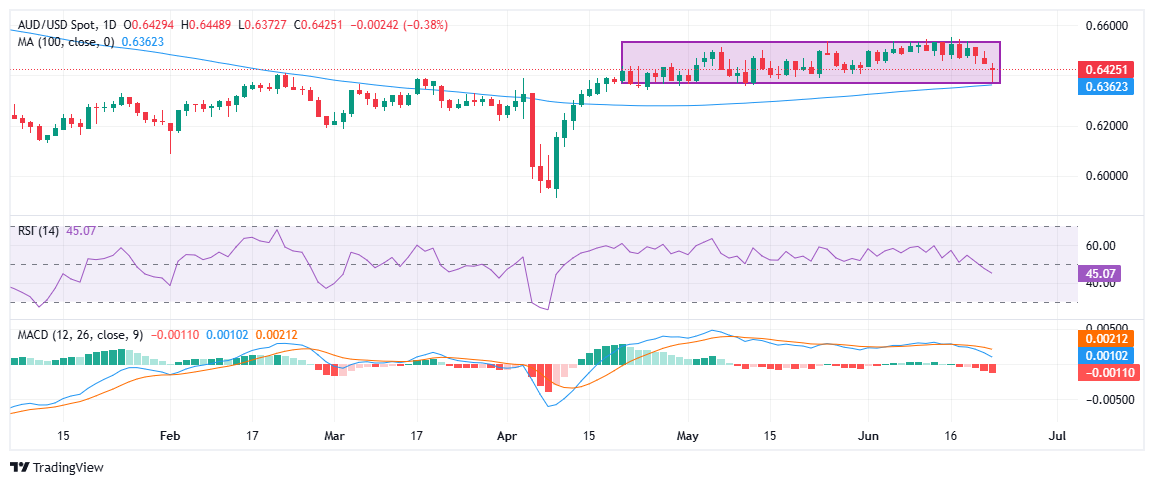
- AUD/USD recovers from a one-month low near 0.6372 as mixed US PMI data cools safe-haven flows into the Greenback.
- S&P Global US Composite PMI slips slightly; manufacturing holds steady, while services softens but beats expectations.
- AUD/USD rebounds from key support near 0.6400; daily close above 0.6450 may open path toward 0.6500–0.6550.
The Australian Dollar (AUD) reverses earlier losses and edges higher against the US Dollar (USD) on Monday, as traders reassess safe-haven flows following the United States’ (US) launch of attacks on Iran over the weekend. The initial rush into the Greenback pushed the Aussie to a one-month low before a mixed batch of US Purchasing Managers Index (PMI) data helped temper US Dollar demand.
AUD/USD is currently trading around 0.6426 at the time of writing, during the American session, having erased most of its intraday losses and now down approximately 0.38% on the day. The pair rebounded strongly from a session low of 0.6372, finding a tailwind as the latest US PMIs failed to deliver a decisive boost to the US Dollar.
US data painted a slightly softer tone, the S&P Global Composite PMI slipped to 52.8 in June from 53 in May, hinting at a mild loss of momentum while still marking over two years of expansion. The Manufacturing PMI held steady at 52, in line with May’s 15-month high and beating forecasts, while the Services PMI dipped to 53.1 from 53.7 but remained above market expectations. Overall, the mixed readings cooled fresh buying interest in the US Dollar, giving AUD/USD room to bounce.
Meanwhile, Fed Governor Michelle Bowman added to the softer Dollar tone, noting that inflation is showing steady progress toward the Fed’s 2% goal and hinting she could back a rate cut as soon as July if the trend continues. Her dovish remarks helped drag the US Dollar Index (DXY) back below the key 99.00 level — it was last seen trading around 98.70, adding extra pressure on the Greenback and giving the Aussie a lift off its lows.
Earlier in the day, S&P Global figures showed Australia’s private sector growing at its second-fastest pace in ten months, with services activity hitting a three-month high and manufacturing holding steady. The encouraging PMI print offered a measure of relief for the Aussie, providing some reassurance after recent soft economic releases had revived talk of possible rate cuts.

Technically, the pair’s strong recovery from the lower edge of its tight range suggests buyers are defending key support near 0.6400, reinforced by the 100-day Moving Average around 0.6362. The Relative Strength Index (RSI) has moved higher toward the midline, and the Moving Average Convergence Divergence (MACD) is flirting with a bearish crossover. A daily close above 0.6450 could open the door for a push back toward the 0.6500–0.6550 area, keeping the range-trading strategies alive. A failure to hold above 0.6400, however, would re-expose the downside toward 0.6300.
Economic Indicator
S&P Global Composite PMI
The Composite Purchasing Managers Index (PMI), released on a monthly basis by S&P Global, is a leading indicator gauging private-business activity in Australia for both the manufacturing and services sectors. The data is derived from surveys to senior executives. Each response is weighted according to the size of the company and its contribution to total manufacturing or services output accounted for by the sub-sector to which that company belongs. Survey responses reflect the change, if any, in the current month compared to the previous month and can anticipate changing trends in official data series such as Gross Domestic Product (GDP), industrial production, employment and inflation. The index varies between 0 and 100, with levels of 50.0 signaling no change over the previous month. A reading above 50 indicates that the Australian private economy is generally expanding, a bullish sign for the Australian Dollar (AUD). Meanwhile, a reading below 50 signals that activity is generally declining, which is seen as bearish for AUD.
Read more.
Last release:
Sun Jun 22, 2025 23:00 (Prel)
Frequency:
Monthly
Actual:
51.2
Consensus:
–
Previous:
50.5
Source:
S&P Global

