An excellent return on invested capital with top-notch profit margins that have further improved faces balance sheet uncertainty. Should you consider buying ADP for its high sector dividend, given the potential of a market correction?
Long Trade Idea
Enter your long position between 300.79 (the low of a previous intra-day breakdown) and 311.99 (the upper band of a horizontal resistance zone).
Market Index Analysis
- Automated Data Processing (ADP) is a member of the NASDAQ 100 and the S&P 500.
- Both indices are near record highs, but the technical rally shows signs of a potential reversal
- The Bull Bear Power Indicator of the NASDAQ 100 shows a negative divergence, and half of a reversal chart pattern has formed.
Market Sentiment Analysis
Equity markets digest US President Trump’s higher-than-expected tariff announcements on several key trading partners. Yesterday’s sell-off showed a mix of disappointment and optimism that President Trump uses threats to apply pressure to reach short-term concessions before backing down towards deadlines. Traders refer to it as the TACO (Trump Always Chickens Out) trade. Central bank actions will also attract more attention after the Reserve Bank of Australia surprised markets by holding rates steady rather than cutting interest rates.
Automated Data Processing Fundamental Analysis
Automated Data Processing is a human resources and management firm with an expanding global footprint. It is best known for its ADP employment report in the US that precedes the official NFP report by two days.
So, why am I bullish on ADP despite its recent sell-off?
ADP has a unique position to invest in smaller, global human resources firms that magnify its strategic position. For example, the acquisition of PEI Mexico. It was a small acquisition that will take a lead role in ADP’s Latin American expansion. The dividend adds to the long-term appeal of ADP in buy-and-hold portfolios, while the return on invested capital ranks in the top two percentiles, confirming the value creation at ADP.
|
Metric |
Value |
Verdict |
|
PE Ratio |
31.53 |
Bullish |
|
PB Ratio |
21.38 |
Bearish |
|
PEG Ratio |
3.26 |
Bearish |
|
Current Ratio |
1.02 |
Bearish |
|
ROIC-WACC Ratio |
Positive |
Bullish |
Automated Data Processing Fundamental Analysis Snapshot
The price-to-earnings (PE) ratio of 31.53 makes ADP a relatively affordable stock in current market conditions. By comparison, the PE ratio for the NASDAQ 100 is 40.70.
The average analyst price target for ADP is 314.87. It suggests nearly full value, but I can see a technical breakout brewing that would re-test recent highs.
Automated Data Processing Technical Analysis
Today’s ADP Signal

ADP Price Chart
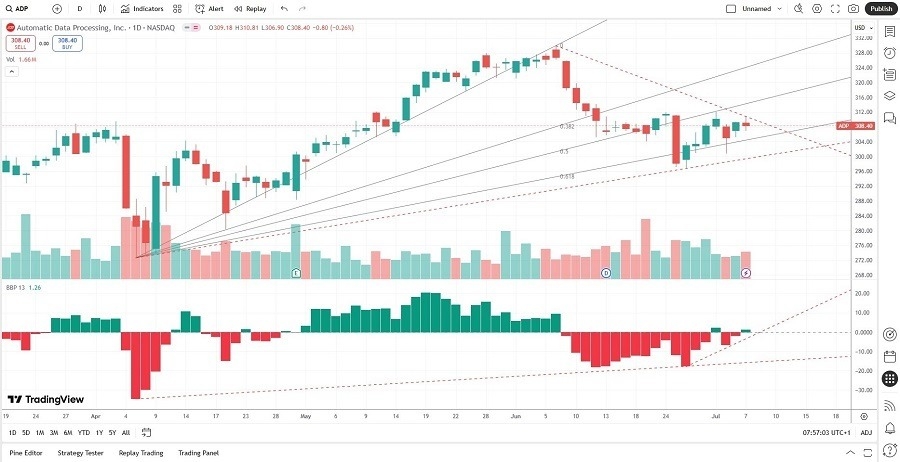
- The ADP D1 chart shows an ascending triangle, a bullish continuation pattern.
- The ascending triangle shows a convergence, magnifying breakout pressures.
- It also shows the Fibonacci Retracement Fan level acting as ascending support that stabilized the previous correction.
- Trading volumes were higher during risk-on sessions.
- The Bull Bear Power Indicator completed a bullish centerline crossover and has shown an uptrend for several days.
My Call
I am taking a long position in ADP between 300.79 and 311.99. While ADP could face short-term selling pressure from a general risk-off sentiment in equity markets, I like the bullish factors that have accumulated. A pending technical breakout could re-test the 2025 high, and any correction provides an improved medium-term entry level.
- ADP Entry Level: Between 300.79 and 311.99
- ADP Take Profit: Between 329.31 and 346.52
- ADP Stop Loss: Between 288.34 and 293.73
- Risk/Reward Ratio: 2.29
Ready to trade our free signals? Here is our list of the best stock trading platforms worth checking out.
