With resistance looming around the $616 level, the question is whether BNB bulls can break through or if a rejection could open the door to a retracement.
BNB Price Climbs Toward Resistance
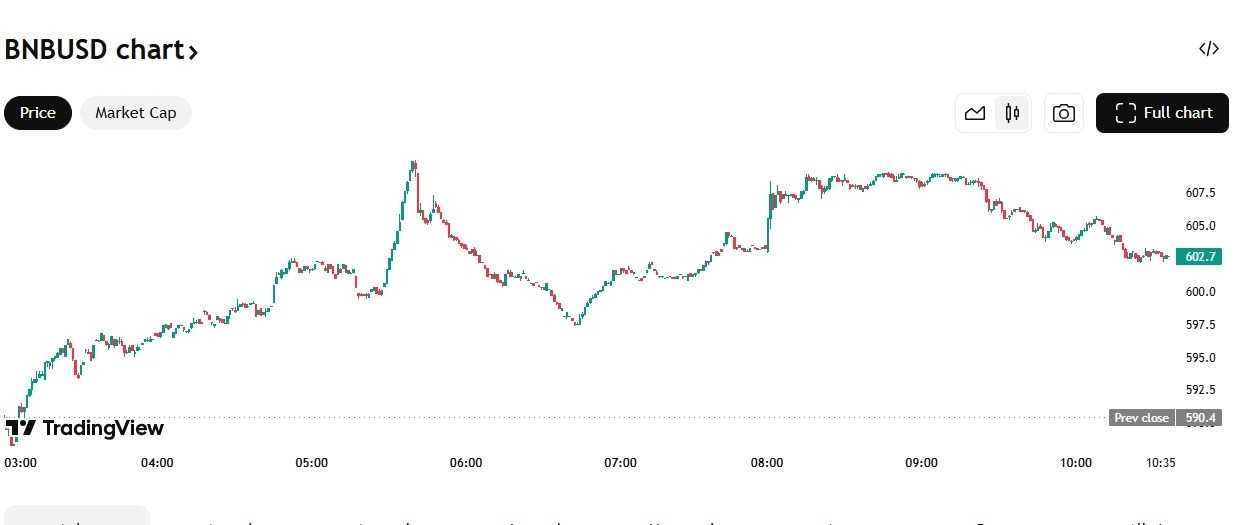
Binance Coin (BNB) price has seen a bullish move in the past day, rising by +2.37% to trade around $603.90.

Binance Coin | Source: TradingView
The price touched an intraday high of $614.19 before easing slightly, and it now hovers just below a critical resistance zone that has capped upside attempts in recent weeks.
This rise follows broader market optimism and a strong technical setup that shows momentum firmly in the bulls’ favor. Both the RSI and MACD on daily timeframes are in positive territory, with momentum building as BNB attempts to reclaim higher ground.
BNB Bulls Eye $618 Breakout
BNB is now pressing against a key resistance zone between $616 and $618. This range has previously acted as a ceiling for price action, rejecting upward movements on multiple occasions.
A confirmed breakout above this range would likely trigger a move toward the next resistance band near $632–$635, where a descending trendline intersects with previous local highs.
So far, BNB has held above the 100-hourly Simple Moving Average, and the current momentum suggests bulls may soon attempt a breakout. Should the $618 level be breached with conviction and backed by volume, it could shift short-term sentiment even further in favor of buyers.
Technical Indicators Flash “Strong Buy”
According to major technical indicators BNB is firmly in bullish territory. Momentum oscillators and moving averages across various timeframes point to a “Strong Buy” signal, indicating that market sentiment remains skewed toward the upside.
The 14-day RSI currently sits in a healthy range, not yet overbought, giving the asset room to extend its rally. Meanwhile, the MACD continues to trend above its signal line, which shows a consistent bullish divergence that could sustain near-term gains.
Short-term moving averages (20, 50, and 100) are also aligned in a bullish formation, with the price trading comfortably above all of them—a strong technical sign that the current trend is supported by market structure.
Price Action Outlook: Support and Scenarios
If bulls manage to clear the $618 resistance, BNB could see a rapid follow-through up to the $635 level. Further up, the $650–$660 region may act as a psychological barrier, particularly if Bitcoin remains steady or gains traction.
However, a rejection at the $618 resistance could trigger a short-term retracement. Initial support lies near $584—the intraday low—and any break below this level could drag the price down to the $570 zone. This level also coincides with the 50-day EMA, a commonly watched support in trending markets.
Below $570, the next strong support sits around $550, a level that previously served as a consolidation base during the March uptrend.
What’s Next for BNB?
While Binance Coin remains in a bullish posture, all eyes are now on the $618 resistance zone. A strong break above this level could confirm the continuation of the current uptrend and unlock further upside potential toward $635 and beyond.
On the flip side, failure to overcome this resistance could trigger short-term profit-taking or even a deeper pullback if key support zones are breached.
For now, the trend is bullish, and the technical structure favors the bulls. But with BNB pressing against a critical resistance wall, traders should brace for volatility—and watch closely to see if bulls can maintain their grip on momentum or if bears are preparing for a counterattack
Ready to trade Cryptocurrency forex forecast? Here’s a list of some of the best crypto brokers to check out.
