Bullish view
- Buy the BTC/USD pair and set a take-profit at 123,200.
- Add a stop-loss at 114,000.
- Timeline: 1-2 days.
Bearish view
- Sell the BTC/USD pair and set a take-profit at 114,000.
- Add a stop-loss at 123,200.

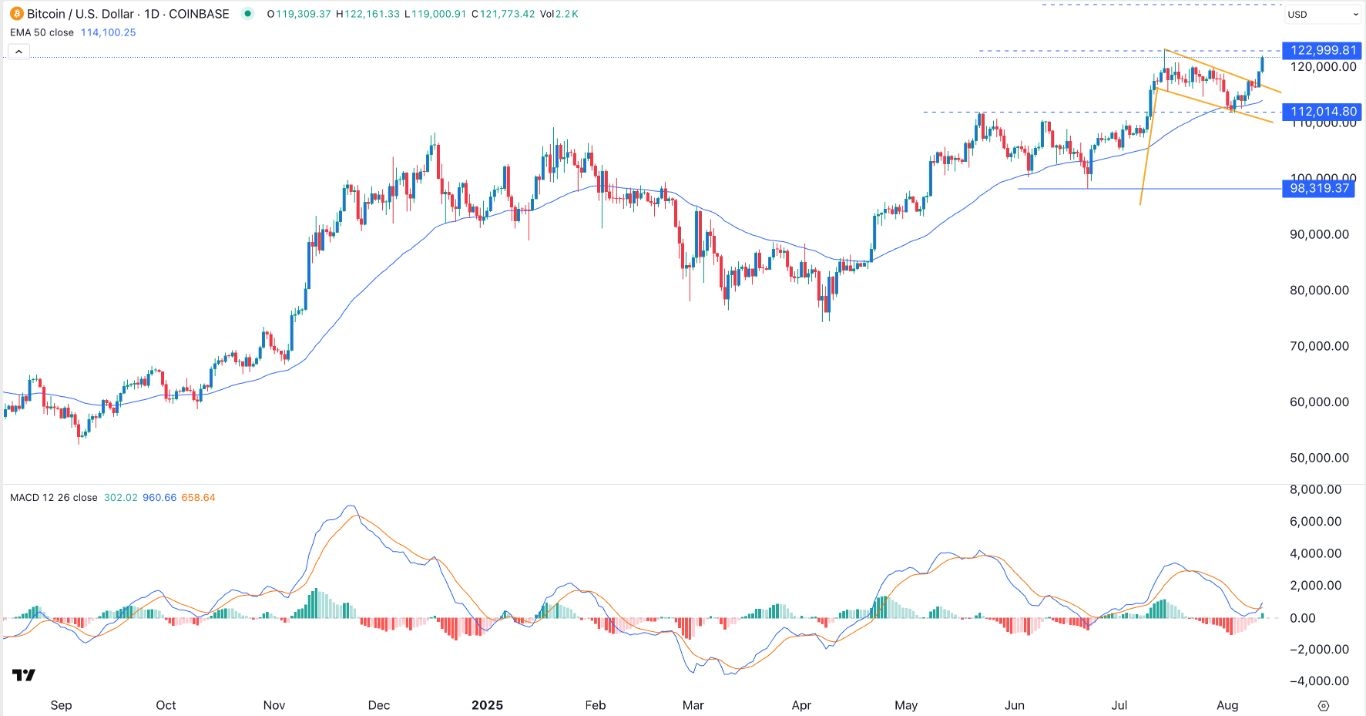
Bitcoin price continued its strong rally on Monday morning as demand from American investors rose. The BTC/USD pair crossed the important resistance level at 120,000, which is a few points below the all-time high of $123,000.
Bitcoin has been in a strong surge in the past few days amid rising demand from Wall Street jumped. Data shows that spot Bitcoin ETF inflows continued the upward trajectory, rising in the last three consecutive days.
They added $403 million assets on Friday, higher than the previous day $280 million. These ETFs now hold assets worth over $54 billion, with BlackRock’s IBIT ETF having over $86 billion in assets. Harvard and Brown Universities’ endowment funds have all invested in IBIT this year.
The BTC/USD pair has also jumped amid the rising hopes that the Federal Reserve will start cutting interest rates soon. These hopes jumped after the US published weak nonfarm payrolls (NFP) data.
The report showed that the US created just 73k jobs in July, while the unemployment rate moved upwards to 4.2%. Odds of Fed cuts will rise if the US publishes weak consumer inflation data on Tuesday. Economists expect the data to reveal that the CPI rose to 2.8% in July.
Bitcoin price has also jumped as the number of Bitcoin treasury companies rose. There are now over 100 companies with Bitcoin holdings, with Strategy being the biggest name in the industry. Other top companies with Bitcoin holdings are MARA, Coinbase, and Tesla.
Additionally, Donald Trump signed a law that will allow retirement funds like 401 (K) to invest in Bitcoin and other cryptocurrencies, a move that will unlock billions to the industry.
BTC/USD Technical Analysis
The daily chart shows that the BTC/USD pair finally made a strong bullish breakout as demand from investors rose. It has remained above the 50-day and 100-day moving averages, a sign that bulls are in control.
Bitcoin has also moved above the upper side of the bullish flag pattern, which often leads to more gains. Also, the Relative Strength Index (RSI) have pointed upwards.
Therefore, the BTC/USD pair will likely keep rising as buyers target the all-time high of 123,200. A move above that level will point to more gains, potentially to the psychological point at 125,000.
Ready to trade our daily Forex signals? Here’s a list of some of the best crypto brokers to check out.
Crispus Nyaga is a financial analyst, coach, and trader with more than 8 years in the industry. He has worked for leading companies like ATFX, easyMarkets, and OctaFx. Further, he has published widely in platforms like SeekingAlpha, Investing Cube, Capital.com, and Invezz. In his free time, he likes watching golf and spending time with his wife and child.
