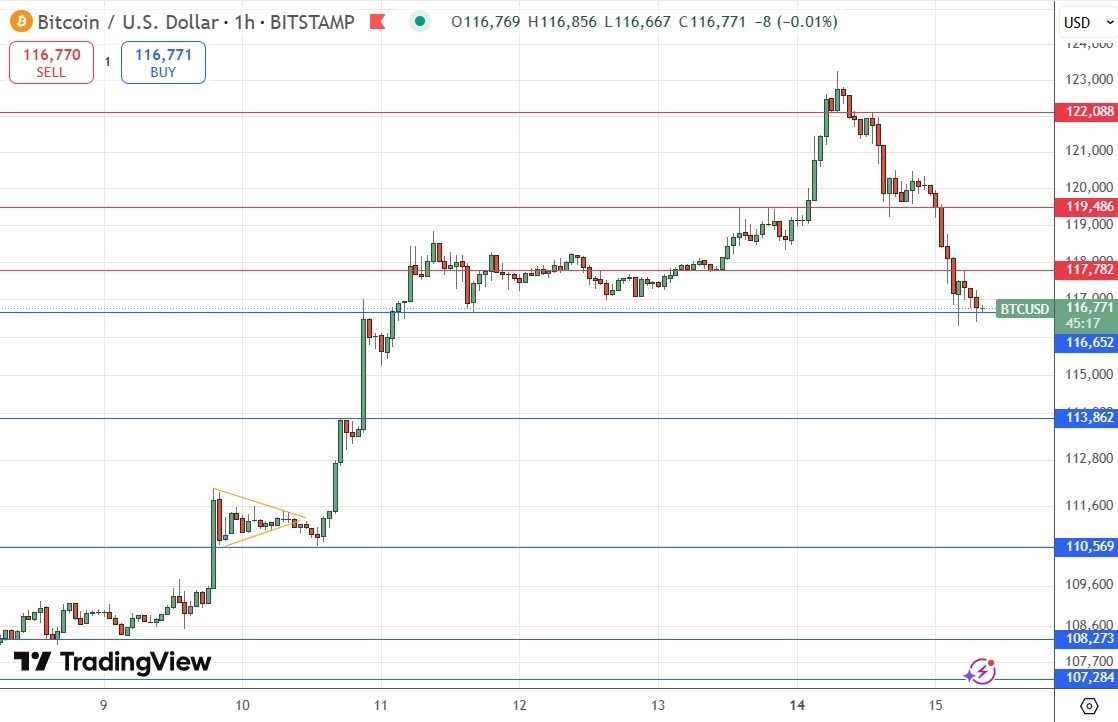
Bitcoin is moving down faster than it came up, suggesting that sellers are in control now, as the price continues to print lower resistance levels while slicing through former support.
My previous BTC/USD signal on 10th July was almost triggered, with the hourly chart printing a bullish doji candlestick with a low just above the key support level I identified at $110,569. This was a fantastically profitable long trade if you were lucky enough to get it.
Today’s BTC/USD Signals
Risk 0.50% per trade.
Trades must be entered prior to 5pm Tokyo time Wednesday.
Long Trade Ideas
- Go long after a bullish price action reversal on the H1 timeframe following the next touch of $116,652, $113,862, or $110,569.
- Put the stop loss $100 below the local swing low.
- Move the stop loss to break even once the trade is $100 in profit by price.
- Take off 50% of the position as profit when the trade is $100 in profit by price and leave the remainder of the position to run.
Short Trade Ideas
- Go short after a bullish price action reversal on the H1 timeframe following the next touch of $117,782, $119,486, or $122,088.
- Put the stop loss $100 above the local swing high.
- Move the stop loss to break even once the trade is $100 in profit by price.
- Take off 50% of the position as profit when the trade is $100 in profit by price and leave the remainder of the position to run.
The best method to identify a classic “price action reversal” is for an hourly candle to close, such as a pin bar, a doji, an outside or even just an engulfing candle with a higher close. You can exploit these levels or zones by watching the price action that occurs at the given levels.
BTC/USD Analysis
I wrote in my previous BTC/USD forecast on 10th July that the technical outlook was extremely bullish, with the price contained within a perfect consolidating triangle. I was expecting a bullish bounce off the support level at $110,569 to trigger a long trade entry.
This was an excellent call, as although the price was just a little short of the level at its low, this dip, bounce and then powerful bullish breakout sequence I envisaged was exactly what happened.
The price took off dramatically, showing extremely strong bullish momentum and driving higher all the way past the round number at $123,000. However, the daily chart shows a bearish pin bar was printed exhibiting a rejection of the big round number at $120,000 and the price has been falling strongly and impulsively from there and is even trading below $117,000 today.
Paradoxically, this shows me something bearish is happening, which is reinforced by the new resistance levels which the price action has printed on its way down.
There are some initial signs of the support level at holding, but I am not very hopeful that this will continue.
I think the price has further to fall despite the long-term bullish trend which survives above the $113,000 area.
So, today I am looking to enter a short trade from a bearish rejection of any of the overhead resistance levels, with $119,486 looking especially attractive.

There is nothing of high importance due today regarding Bitcoin. Concerning the US Dollar, there will be a release of US CPI data at 1:30pm London time.
Ready to trade our daily Forex signals on Bitcoin? Here’s our list of the best MT4 crypto brokers worth checking out.

