Bearish view
- Sell the BTC/USD pair and set a take-profit at 78,000.
- Add a stop-loss at 89,000.
- Timeline: 1-2 days.
Bullish view
- Buy the BTC/USD pair and set a take-profit at 89,000.
- Add a stop-loss at 78,000.

The BTC/USD pair remained under pressure as investors abandoned risky assets ahead of Donald Trump’s reciprocal tariffs announcement. Bitcoin was trading at $83,200 on Tuesday, down by over 23% from its highest level this year.
Risk-off sentiment continues
The BTC/USD pair has struggled to find direction as concerns that the US may sink into a recession this year. Donald Trump will impose his Liberation Day tariffs on Wednesday, a move that will mostly affect the US.
He has already imposed tariffs on goods from Canada and Mexico, two of the biggest trading partners. Goods from the two countries are now being charged a 25% tariff, up from zero.
Trump also announced a 25% tariff on all imported vehicles to the US, a move that will push prices higher.
The upcoming tariffs will largely target Asian countries like India, Japan, and South Korea, and European countries that export goods worth billions of dollars to the US. Most of these goods will keep moving to the United States, but at a higher price to consumers.
The tariffs will likely disrupt the US inflation trend that has been moving in the right direction in the past few months. Data released last week showed that the headline and core personal consumption expenditure (PCE) inflation figures remained higher in February.
Bitcoin’s recent crash has happened as investors have moved to other safe haven assets like gold. Gold has jumped to a record high this year and has outperformed other assets like crypto and stocks. That is a sign that investors see gold as a better safe-haven asset than Bitcoin.
BTC/USD technical analysis
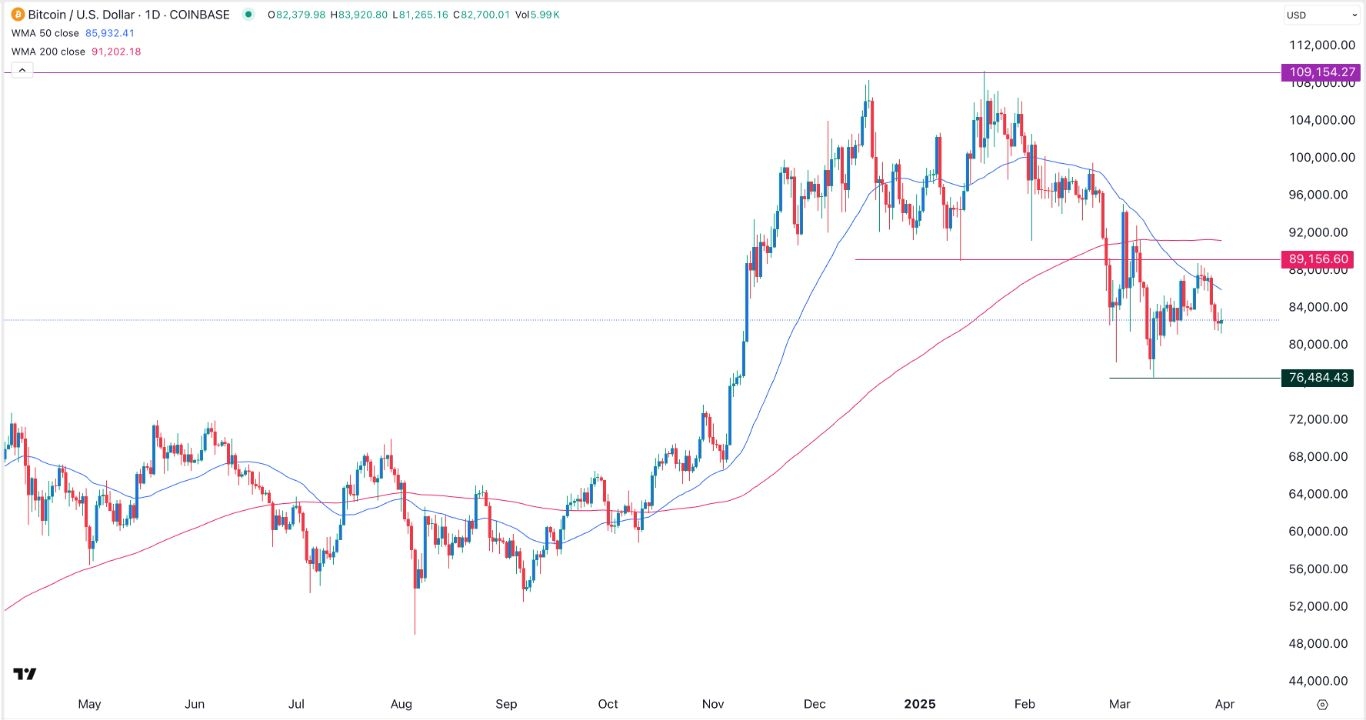
The BTC/USD pair has remained under pressure in the past few months, falling from a high of 109,200 to 82,800. It has even formed a death cross pattern as the 50-day and 200-day Weighted Moving Averages (WMA) flipped each other.
Most recently, Bitcoin formed a break-and-retest pattern by retesting the crucial resistance level at 89,155, its lowest point on January 13. The pair has also formed a rising wedge pattern, a popular bearish reversal sign.
Therefore, there is a likelihood that it will continue falling as sellers target the key support at 76,500, its lowest level in March. A move above the resistance point at 89,156 point will invalidate the bearish view.
Ready to trade our free daily Forex trading signals? We’ve shortlisted the best MT4 crypto brokers in the industry for you.
