Bearish view
- Sell the BTC/USD pair and set a take-profit at 70,000.
- Add a stop-loss at 84,000.
- Timeline: 1-2 days.
Bullish view
- Buy the BTC/USD pair and set a take-profit at 84,000.
- Add a stop-loss at 70,000.

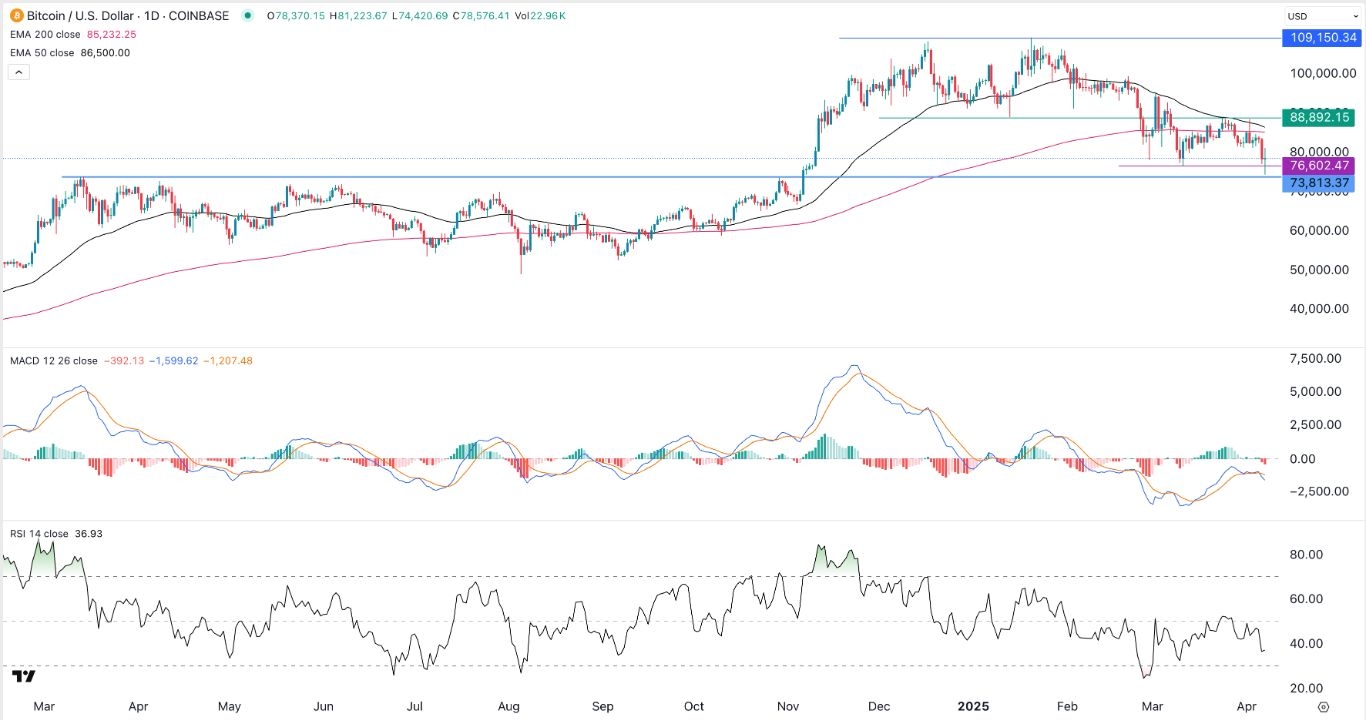
Bitcoin price continued its strong sell-off this week as concerns about the trade war between the United States and other countries gained steam. The BTC/USD pair dropped to a low of 74,430 on Monday, its lowest point since November 10 last year, down by 32% from the highest point this year.
Trade war concerns remain
The BTC/USD pair continued its downward trend as investors remained concerned about the US trade war. On Monday, Trump threatened to apply a 50% tariff on all goods imported from China if Beijing maintain its 34% tariff on US goods.
The ongoing trade war means that the US and the global economy may plunge into a recession. Goldman Sachs analysts have placed a 45% chance that the US would sink into a recession this year. JPMorgan analysts have also upgraded their recession odds to 60%. Analysts at other companies like PIMCO and Citigroup have raised their recession odds.
On the positive side, a recession would be a good thing for Bitcoin and other cryptocurrencies since it would push the Federal Reserve to cut interest rates. Goldman Sachs analysts expect that the Fed will deliver three rate cuts this year.
The next key catalyst for the BTC/USD pair will be the trade news by Donald Trump. With the stock market in a deep bear market and with political pressure rising, there is a likelihood that Trump may start talking with other countries. He has already hinted that Japan and Vietnam were ready to do a deal.
Bitcoin price will also react to the upcoming FOMC minutes on Wednesday. These minutes will provide more information about the last meeting by the Federal Reserve.
BTC/USD technical analysis
The daily chart shows that the BTC/USD pair formed a double-top pattern at 109,150, and whose neckline was at 88,892, its lowest point on January 13. It has also formed a break-and-retest pattern by retesting the resistance level at 88,892.
The pair is also about to form a death cross pattern as the 50-day and 200-day Exponential Moving Averages (EMA) near their crossover. It also moved below the key support at 76,600, the lowest swing on March 11. The MACD and the Relative Strength Index (RSI) have pointed downwards.
Therefore, the pair will likely continue falling as long as bears move below the key support at 73,813, the highest swing in March last year. A drop below that level will point to more downside, with the next level to watch being at 70,000. A move above the 50-day moving average at 86,500 will invalidate the bearish view.
Ready to trade our free Forex signals? Here are the best MT4 crypto brokers to choose from.
