Bullish view
- Buy the BTC/USD pair and set a take-profit at 115,000.
- Add a stop-loss at 104,000.
- Timeline: 1-2 days.
Bearish view
- Sell the BTC/USD pair and take a profit at 104,000.
- Add a stop-loss at 115,000.

Bitcoin price remained in a tight range on Thursday as the recent momentum faded. The BTC/USD pair was trading at 109,000, a few points below this week’s high of 110,400. It has jumped by almost 50% from its highest point this year.
Bitcoin stalled even as the US published relatively encouraging inflation data. Bureau of Labor Statistics data showed that the headline consumer inflation rose from 2.3% to 2.4% in May, a smaller increase than was expected.
Core inflation also remained unchanged at 2.8%, meaning that Donald Trump’s tariffs have not had a major impact on prices so far. Bitcoin and other risky assets do well when there are signs of stable inflation in the country.
Bitcoin also reacted mildly to the truce between the United States and China. While details are scant, the two sides are expected to reduce their export controls in the coming days. The US is particularly concerned about China’s rare earth controls.
On the positive side for Bitcoin, data shows that spot ETFs have continued to have substantial inflows. They have had inflows in the last three consecutive days, bringing the total amount to $45 billion.
Bitcoin’s inflows are rising as data show that exchange supply continues moving downwards. There are now about 1.1 million coins on exchanges, down from over 3 million a few years ago.
BTC/USD technical analysis
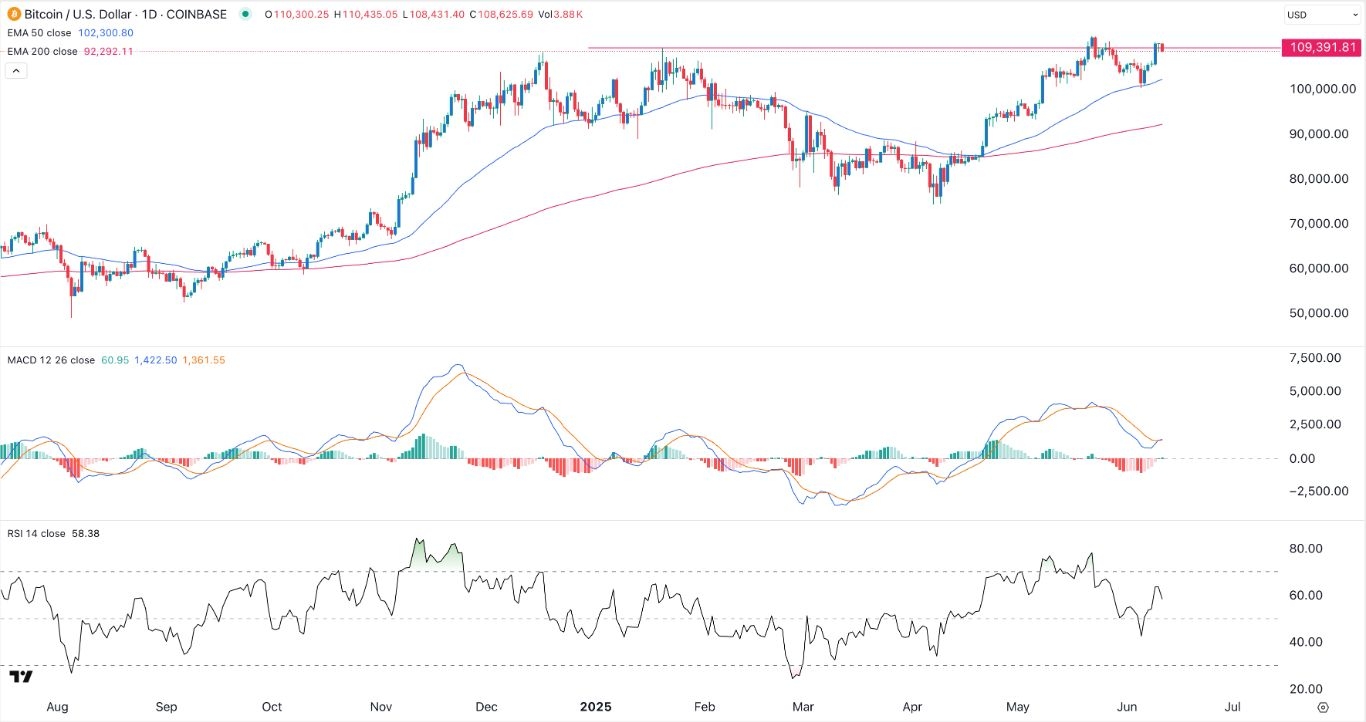
The daily chart shows that the BTC/USD pair has moved sideways in the past few days as the recent momentum faded. It is hovering at an important level that was at its highest point on January.
The pair is also along the upper side of the cup-and-handle pattern, one of the most bullish continuation signs. This pattern is made up of a rounded bottom and some consolidation.
The BTC/USD pair has remained above the 50-day and 200-day Exponential Moving Averages (EMA), a sign that bulls are in control.
Therefore, Bitcoin price will likely bounce back and move above the all-time high. If this happens, the next point to watch will be at 115,000. A drop below the 50-day moving average at 102,303 will invalidate the bullish outlook and point to more downside.
Ready to trade our daily Forex signals? Here’s a list of some of the best crypto brokers to check out.
Crispus Nyaga is a financial analyst, coach, and trader with more than 8 years in the industry. He has worked for leading companies like ATFX, easyMarkets, and OctaFx. Further, he has published widely in platforms like SeekingAlpha, Investing Cube, Capital.com, and Invezz. In his free time, he likes watching golf and spending time with his wife and child.
