Bullish view
- Buy the BTC/USD pair and set a take-profit at 123,200.
- Add a stop-loss at 112,000.
- Timeline: 1-2 days.
Bearish view
- Sell the BTC/USD pair and set a take-profit at 112,000.
- Add a stop-loss at 123,000.

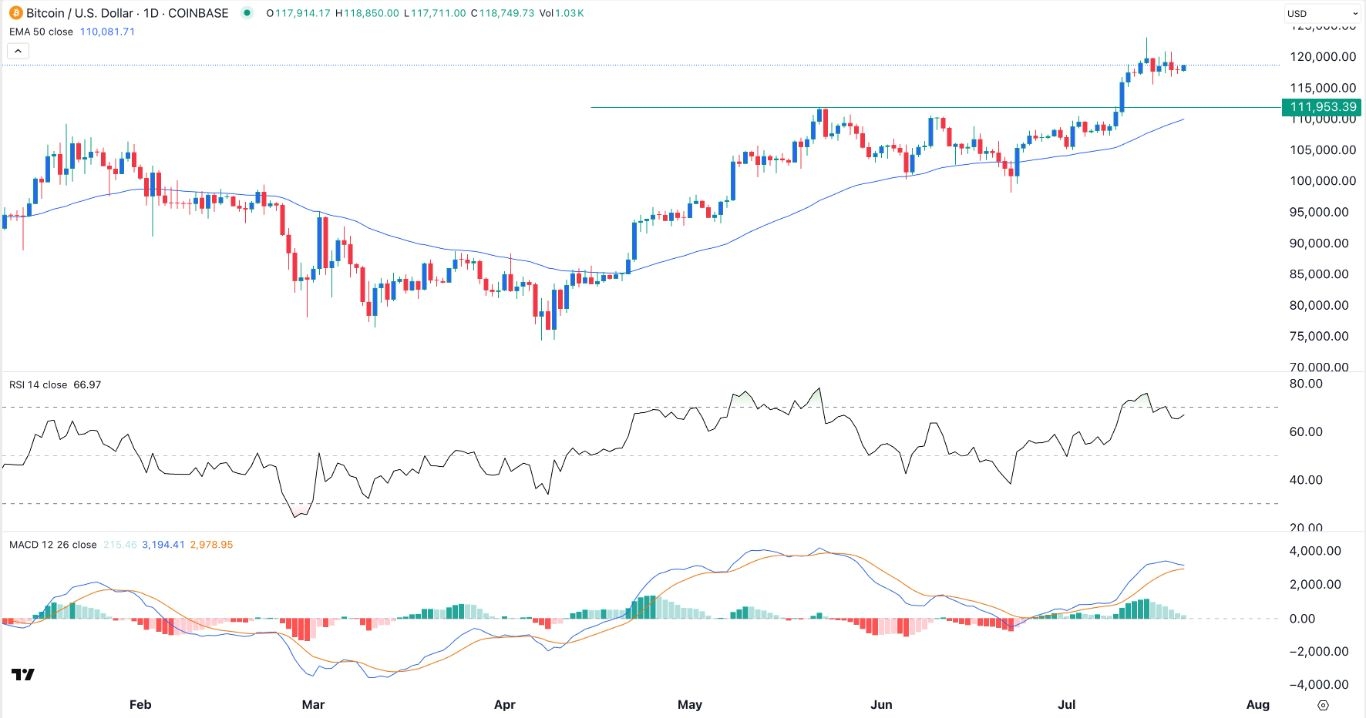
The Bitcoin price was stuck in a tight range on Monday morning, continuing a trend that began last week after it reached a record high. The BTC/USD pair was trading at 118,455, a few points below the year-to-date high of 123,200.
Bitcoin price continues to have strong fundamentals, with third-party data showing strong exchange-traded funds (ETF) inflows. Data shows that these funds added over $2.39 billion in inflows last week, bringing the all-time inflows to over $54.7 billion. These funds now hold over $152 billion in assets.
Bitcoin is also seeing strong demand from treasury companies like Strategy, GameStop, and MetaPlanet that likely continued their accumulation last week.
At the same time, Bitcoin’s supply continues to drop this year. Recent data shows that the supply of Bitcoin in exchanges has continued falling in the past few months. There are now about 1.2 million coins in exchanges, down from over 1.5 million last month.
Bitcoin price also wavered after Donald Trump signed the GENIUS Act into law last week. He also signaled that he would allow retirement funds to invest in cryptocurrencies, a move that would lead to more demand this years.
Bitcoin’s wavering has also coincided with the ongoing US dollar index comeback. The index has jumped to $99 from the year-to-date low of $96.
BTC/USD Technical Analysis
The daily chart shows that the BTC/USD pair has remained in a tight range in the past few days. It has remained slightly above the key support level at 111,953, its highest level since May 2022.
The BTC/USD pair has also remained above the 50-day and 100-day Exponential Moving Averages (EMA), which is a positive sign.
It has formed a bullish pennant pattern, a popular continuation sign. However, the Relative Strength Index (RSI) has moved below the overbought level, while the two lines of the MACD are about to cross each other.
Therefore, the coin will likely have a strong bullish breakout as bulls target the year-to-date high of 123,200. However, there is a risk that it may lose momentum and retest the support at 111,953. Such a move will be bullish as it will be a break-and-retest pattern.
Crispus Nyaga is a financial analyst, coach, and trader with more than 8 years in the industry. He has worked for leading companies like ATFX, easyMarkets, and OctaFx. Further, he has published widely in platforms like SeekingAlpha, Investing Cube, Capital.com, and Invezz. In his free time, he likes watching golf and spending time with his wife and child.
