Bullish view
- Buy the BTC/USD pair and set a take-profit at 110,100.
- Add a stop-loss at 98,300.
- Timeline: 1-2 days.
Bearish view
- Sell the BTC/USD pair and set a take-profit at 98,300.
- Add a stop-loss at 108,100.

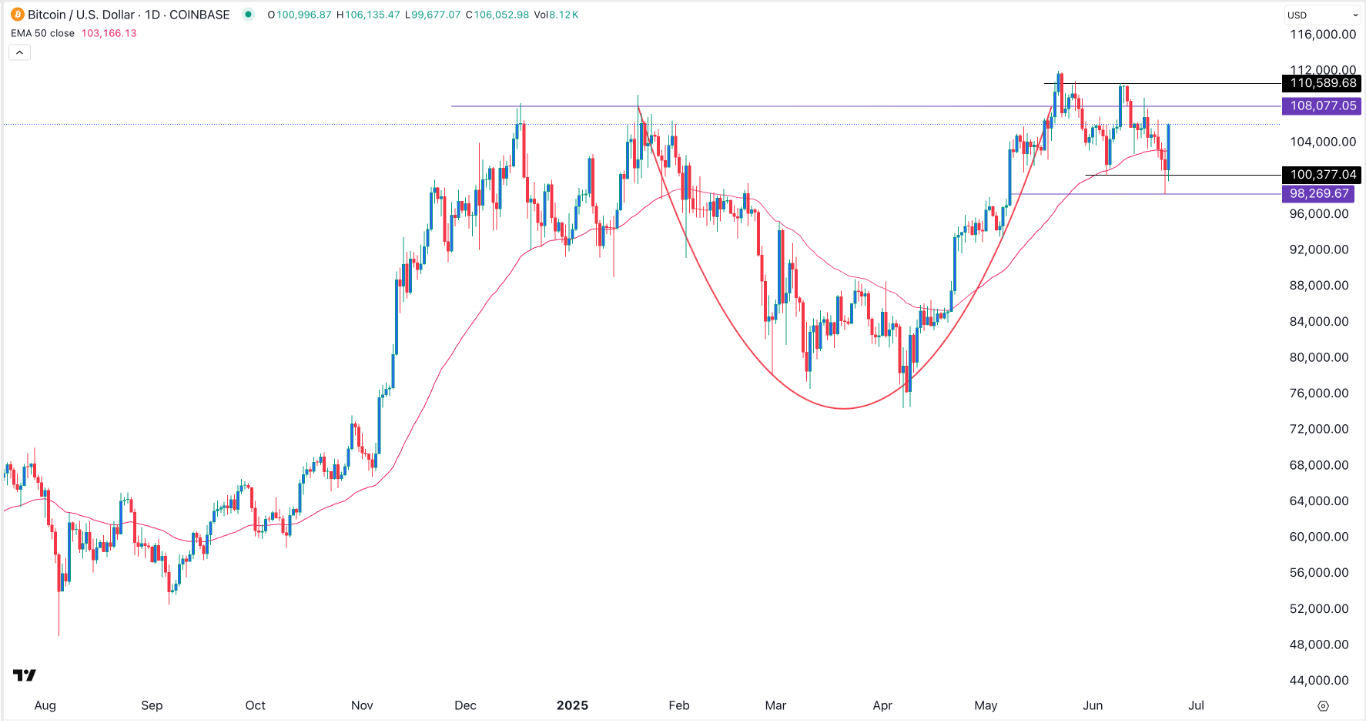
Bitcoin price retreated below $100,000 on Sunday and then bounced back as traders watched the developments in the Middle East. The BTC/USD pair rose from a low of 98,152 on Sunday to over 106,000.
Bitcoin Rises Amid Geopolitical Tensions
Bitcoin and other risky assets rose after Iran launched a retaliatory attack against a US base in Qatar. The Dow Jones Index rose by over 250 points, while the S&P 500 and the Nasdaq 100 rose by 42 and 160 points, respectively.
At the same time, crude oil prices erased the gains made on Monday morning, with Brent falling to $71 and the West Texas Intermedite (WTI) crashing to $69. The two had peaked above $80 on Monday.
This price action happened after Qatar confirmed that it had repelled all missile attacks from Iran. The market hopes that the Trump administration will not retaliate against Iran since no American was lost.
Bifcoin price also rose after another dovish statement from a Federal Reserve official. Michele Bowman said that she supported cutting interest rates as soon as in the July meeting.
Like Christopher Waller, Bowman said that recent data signaled that Donald Trump’s tariffs were having a limited impact on inflation. The most recent data showed that the US inflation rose from 2.3% in April to 2.4% in May, missing the analysts estimate of 2.5%.
Looking ahead, Bitcoin will react to the upcoming US Consumer Confience data by the Conference Board. Economists see the figure coming in at 99.8, up from 98 in the previous month.
The other top catalyst will be a statement by Jerome Powell, the Federal Reserve Chair, who will testify before Congress. A dovish statement would be bullish for Bitcoin and other coins.
BTC/USD technical analysis
The daily chart shows that the BTC/USD pair bottomed at 98,270 on Sunday. It formed a morning star candlestick pattern and moved above the 100-day Exponential Moving Average (EMA).
The pair moved above the important resistance level at 100,377, its lowest swing on June 5. This price was the neckline of the double-top pattern at 110,590.
Bitcoin is also forming the handle section of the cup-and-handle pattern, a popular bullish sign. Therefore, Bitcoin price will likely continue rising as bulls target the next key resistance point at 110,000. A drop below the support at 100,000 will point to more downside.
Ready to trade our free Forex signals? Here are the best MT4 crypto brokers to choose from.
Crispus Nyaga is a financial analyst, coach, and trader with more than 8 years in the industry. He has worked for leading companies like ATFX, easyMarkets, and OctaFx. Further, he has published widely in platforms like SeekingAlpha, Investing Cube, Capital.com, and Invezz. In his free time, he likes watching golf and spending time with his wife and child.
