Bullish view
- Buy the BTC/USD pair and set a take-profit at 123,200.
- Set a stop-loss at 114,000.
- Timeline: 1-2 days.
Bearish view
- Sell the BTC/USD pair and set a take-profit at 114,000.
- Add a stop-loss at 123,000.

Bitcoin price remained in a tight range on Thursday morning as the recent bullish trend gained steam. The BTC/USD pair was trading at 118,530, a range it has remained in the past few days. It has remained below the year-to-date high of 123,200.
Bitcoin price has remained under pressure as investors remained in the sidelines following the recent surge. It moved from a low of $74,375 in April this year to the current $118,465.
Recent data shows that ETF inflows have remained on edge this week. Still, these funds now have over $54.5 billion in assets, making Bitcoin the fastest-growing assets. For example, the iShares Bitcoin ETF (IBIT) as over $87 billion in assets under management. The other top funds like Fidelity, Ark Invest, Grayscale, and Bitwise have all added billions since their inception.
The BTC/USD pair has remained in a tight range even as the US dollar index (DXY) continued falling. It moved from a low of $97, down from this month’s high of $98.8. Similarly, the US stock market has continued doing well, with the Nasdaq 100 and S&P 500 indices soaring to a record high.
BTC/USD Technical Analysis
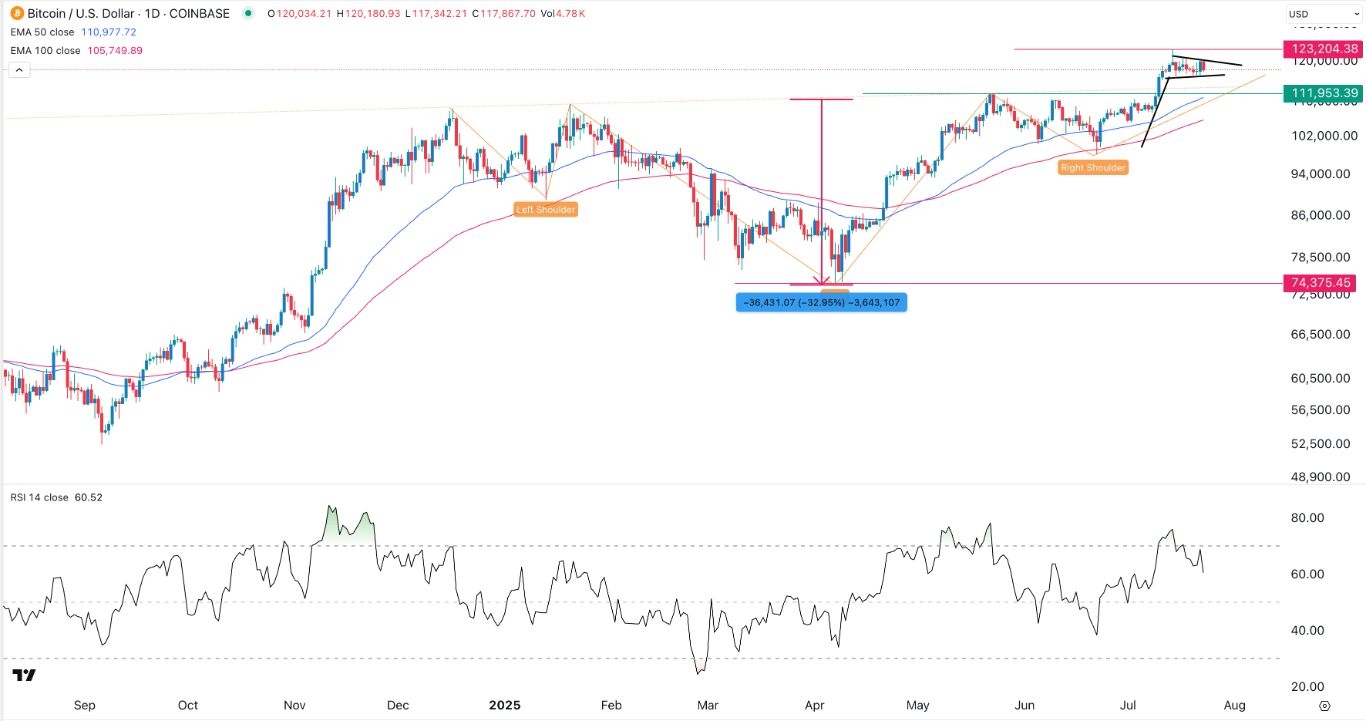
Bitcoin price has been in a strong bull run in the past few months, moving from a low of 74,375 in April to a record high of 123,204. On the daily chart, the BTC/USD pair formed an inverse head-and-shoulders pattern, a popular bullish reversal sign.
The pair is now forming a bullish pennant pattern, comprising of a vertical line and a symmetrical triangle pattern. The two sides of the triangle are about to converge, pointing to more gains.
Bitcoin has remained above the 50-day and 100-day moving averages, a highly bullish sign. Therefore, the BTC/USD pair will likely continue rising as bulls target the year-to-date high of 123,200. The alternative scenario is where the pair continues falling, with the next point to watch being at 111,950, the upper side of the inverse H&S pattern.
Ready to trade our free Forex signals? Here are the best MT4 crypto brokers to choose from.
Crispus Nyaga is a financial analyst, coach, and trader with more than 8 years in the industry. He has worked for leading companies like ATFX, easyMarkets, and OctaFx. Further, he has published widely in platforms like SeekingAlpha, Investing Cube, Capital.com, and Invezz. In his free time, he likes watching golf and spending time with his wife and child.
