Bullish view
- Buy the BTC/USD pair and set a take-profit at 112,000.
- Add a stop-loss at 104,000.
- Timeline: 1-2 days.
Bearish view
- Sell the BTC/USD pair and set a take-profit at 104,000.
- Add a stop-loss at 112,000.

Bitcoin price held steady on Monday as most of the recent risks in the market faded. The BTC/USD pair rose to a high of 107,940, up nearly 10% from its current level. It has also jumped by over 45% from the lowest level in April this year.
The BTC/USD pair has been in a strong bull run over the past few days, as demand continues to rise and investors adopt a risk-on sentiment. For example, the S&P 500 and Nasdaq 100 indices have surged to a record high, while the US Dollar Index (DXY) has plunged to the lowest point since 2021.
Bitcoin price has also done well with the ongoing spot ETF inflows as US investors pile in. Data shows that the weekly ETF inflows jumped by $2.2 billion last week, a big increase from the previous week’s $1.02 billion. The inflows increased by over $1.39 billion the previous week.
Therefore, spot Bitcoin ETFs have added over $48.87 billion in inflows since their inception. BlackRock’s IBIT ETF has added over $52 billion in assets since January last year and now holds $74 billion in assets.
More data reveals that Bitcoin’s supply in exchanges has continued plunging in the past few months and now sits at the lowest level in years.
BTC/USD Technical Analysis
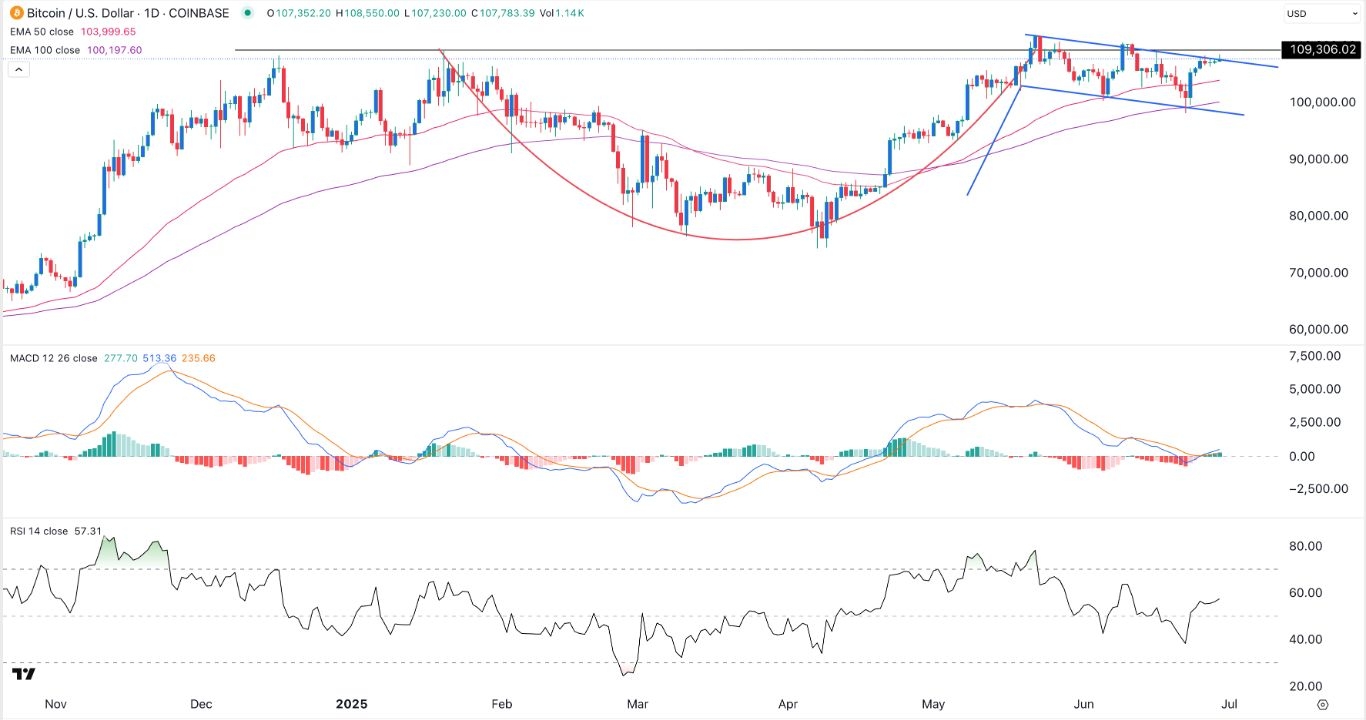
The daily chart shows that the BTC/USD pair has bounced back after crashing to below 100,000 last week. It moved to a high of 107,810, and is hovering near its highest point this year.
Bitcoin has surged above the 50-day and 100-day Exponential Moving Averages (EMA), a sign that bulls are in control. The coin has formed a bullish flag chart pattern, which is made up of a vertical line and a descending channel.
The BTC/USD pair has also formed a cup-and-handle pattern, a popular bullish indicator. It is one of the most bullish continuation sign in technical analysis.
The Relative Strength Index (RSI) has moved above the neutral point at 50, while the MACD has moved above the zero line. Therefore, the pair will likely continue as bulls target the all-time high of 112,000. A move below the support at 104,000 will invalidate the bullish view.
Ready to trade our free Forex signals? Here are the best MT4 crypto brokers to choose from.
Crispus Nyaga is a financial analyst, coach, and trader with more than 8 years in the industry. He has worked for leading companies like ATFX, easyMarkets, and OctaFx. Further, he has published widely in platforms like SeekingAlpha, Investing Cube, Capital.com, and Invezz. In his free time, he likes watching golf and spending time with his wife and child.
