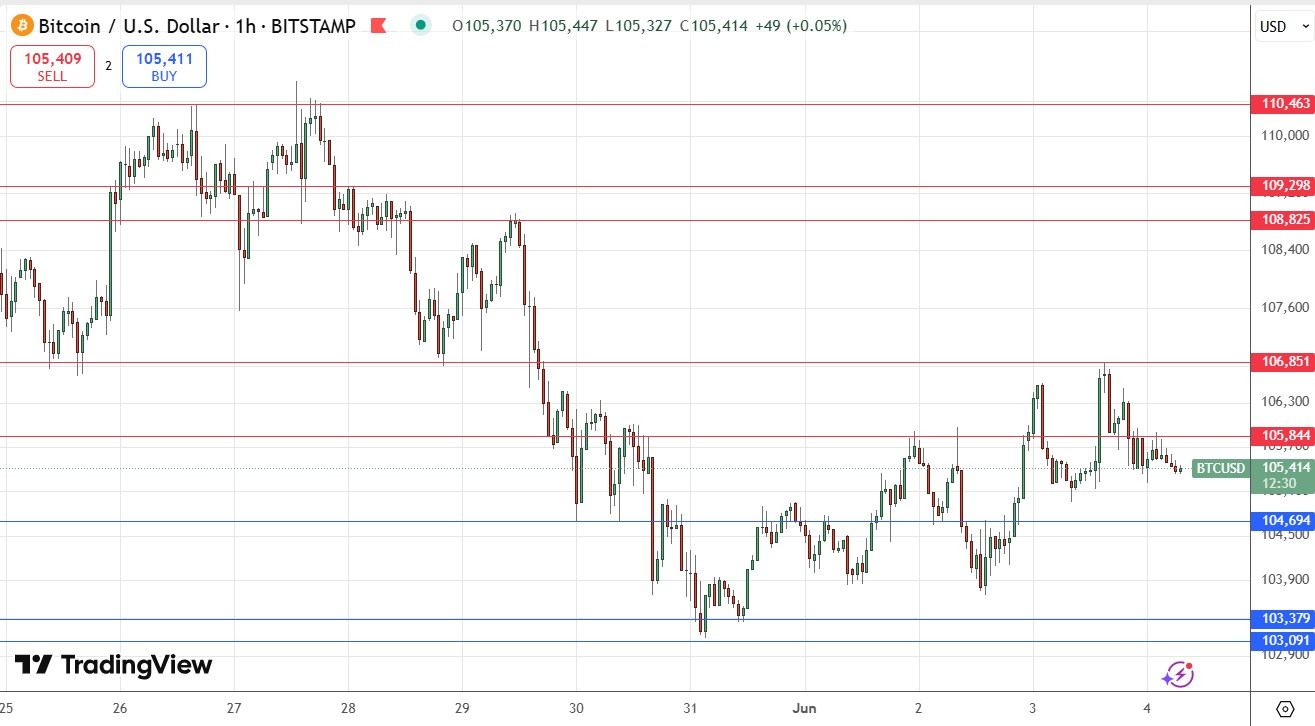
My previous BTC/USD signal on 13th May gave a nicely profitable long trade from the bullish bounce at the support level which I had identified at $101,581.

Today’s BTC/USD Signals
Risk 0.50% per trade.
Trades must be entered prior to 5pm Tokyo time Thursday.
Long Trade Ideas
- Go long after a bullish price action reversal on the H1 timeframe following the next touch of $104,694, $103,379, or $103,091.
- Put the stop loss $100 below the local swing low.
- Move the stop loss to break even once the trade is $100 in profit by price.
- Take off 50% of the position as profit when the trade is $100 in profit by price and leave the remainder of the position to run.
Short Trade Ideas
- Go short after a bearish price action reversal on the H1 timeframe following the next entry into the zone between of $105,844, $106,851, or $108,825.
- Put the stop loss $100 above the local swing high.
- Move the stop loss to break even once the trade is $100 in profit by price.
- Take off 50% of the position as profit when the trade is $100 in profit by price and leave the remainder of the position to run.
The best method to identify a classic “price action reversal” is for an hourly candle to close, such as a pin bar, a doji, an outside or even just an engulfing candle with a higher close. You can exploit these levels or zones by watching the price action that occurs at the given levels.
BTC/USD Analysis
I wrote in my previous BTC/USD forecast on 13th May that the price looked likely to challenge the zone of resistance between $103,091 and $103,379 which could see a significant breakout if the price got established above the high. This was a good call, as after breaking above that, the price made another bottom at $101,581 and then the price really took off, eventually climbing to reach a new record high at about $112,000.
However, the past two weeks have seen the price make a clear and sustained bearish move, with lower lows and lower highs, and the price action printing increasingly lower resistance levels.
This suggests that bears are in the driving seat. Yet it can be said that the support level below at $101,581 still looks like it could be a formidable obstacle to bears.
It is also worth noting that the bearish decline has not yet been enough to shake out long-term trend traders.
I would take a short trade from a clear rejection of a resistance level today, but I would also take a long trade from a strong bullish bounce at $101,581.
If the price gets established below $101,581 I think we will see an accelerated decline.
There is nothing of high importance due today regarding Bitcoin. Concerning the US Dollar, there will be a release of ADP Non-Farm Employment (forecast) data at 1:30pm London time, followed by ISM Services PMI at 3pm.
Ready to trade our daily Forex signals on Bitcoin? Here’s our list of the best MT4 crypto brokers worth checking out.
