Bearish view
- Sell the GBP/USD pair and set a take-profit at 1.3470.
- Add a stop-loss at 1.3880.
- Timeline: 1-2 days.
Bullish view
- Buy the GBP/USD pair and a take-profit at 1.3880.
- Add a stop-loss at 1.3470.

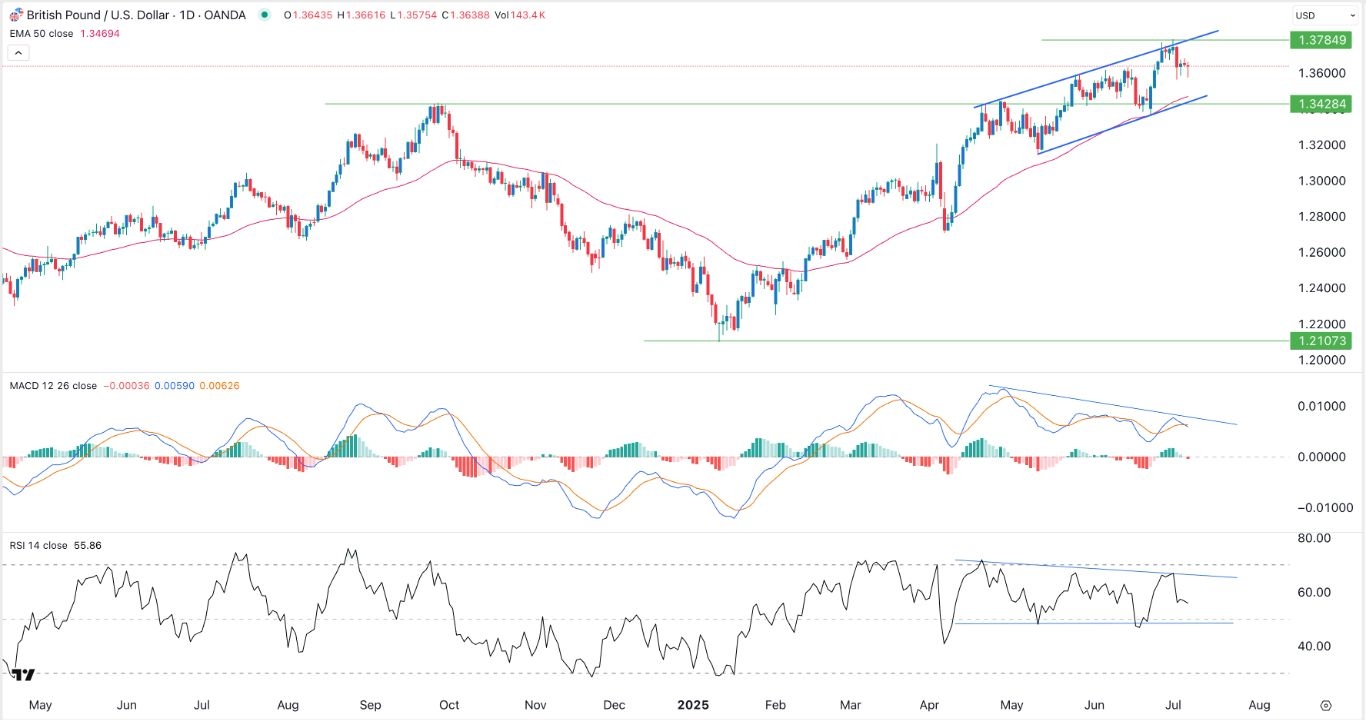
The GBP/USD exchange rate pulled back as the US dollar index rose slightly after Donald Trump extended his tariff deadline. The pair retreated to a low of 1.3600, down from the year-to-date high of 1.3780.
US Dollar Index Stages a Relief Rally
The GBP/USD exchange rate retreated as the US dollar bounced back afte Trump extended his tariff deadline. In a statement, Trump said that tariffs will revert to those he announced in April for countries that have not made a deal with the United States.
Fortunately for the UK, the two countries reached a deal in May that excluded some of its top exports to the US from tariffs. The US has already reached a deal with China and Vietnam.
The pair also pulled back after the UK published the house price index (HPI) data. Accodng to Halifax, the house price index (HPI) rose from minus 0.3% in May to 0% in June, translating to an annuallized increase of 2.5%.
The next key UK data to watch this week will come out on Friday when the country releases the latest GDP data. Economists expect the data to show that the economy grew by 0.1% in May after contracting by 0.3% in the previous month. The UK will also publish the latest UK industrial and manufacturing production data.
The GBP/USD pair will also react to the upcoming Federal Reserve minutes data scheduled on Wednesday. This report will provide more details into what happened in the June meeting in which officials left interest rates unchanged.
While the FOMC minutes are important, their impact will be limited because of last Friday’s nonfarm payrolls data. These numbers showed that the economy created 147k jobs, while the unemployment rate dropped to 4.1%.
GBP/USD Technical Analysis
The daily chart shows that the GBP/USD pair has been in an uptrend in the past few months. It has formed an ascending channel, and recently moved below its upper side.
The pair has remained above the 50-day and 100-day Exponential Moving Averages (EMA). Also, the Relative Strength Index (RS) and the MACD indicators have formed a bearish divergence pattern.
Therefore, the pair will likely continue falling as sellers target the 50-day moving average at 1.3470. A move above the upper side of the channel at 1.3784 will invalidate the bearish view.
Ready to trade our Forex daily forecast? We’ve shortlisted the best regulated forex brokers UK in the industry for you.
Crispus Nyaga is a financial analyst, coach, and trader with more than 8 years in the industry. He has worked for leading companies like ATFX, easyMarkets, and OctaFx. Further, he has published widely in platforms like SeekingAlpha, Investing Cube, Capital.com, and Invezz. In his free time, he likes watching golf and spending time with his wife and child.
