Bearish view
- Sell the AUD/USD pair and set a take-profit at 0.6400.
- Add a stop-loss at 0.6600.
- Timeline: 1-2 days.
Bullish view
- Buy the AUD/USD pair and set a take-profit at 0.6600.
- Add a stop-loss at 0.6400.

The AUD/USD pair rallied and reached its highest level since December 2 after a report showed that US trade deficit surged in March. It soared to a high of 0.6500, up by almost 10% from its lowest point this year.
Federal Reserve interest rate decision
The AUD/USD pair continued rising this week after data by the Commerce Department revealed that the US trade deficit widened to over $140 billion in March as companies rushed to buy goods overseas ahead of Trump’s Liberation Day tariffs. The deficit jumped from $123 billion in February, and was higher than the median estimate of $136 billion.
These numbers helped to contribute to the 0.4% contraction in the first quarter. It is against this backdrop that the Federal Reserve will deliver its interest rate decision on Wednesday.
Economists anticipate that the central bank will decide to leave interest rates unchanged at 4.50% in this meeting. Officials have recently noted that they were not in a hurry to cut interest rates as it observes the impact of Trump’s tariffs on the economy.
The AUD/USD pair has also jumped after Trump hinted that he will be ready to deal with China. A potential deal would help to reduce the ongoing tensions. It will also boost Australia’s economy since China is its biggest market.
AUD/USD technical analysis
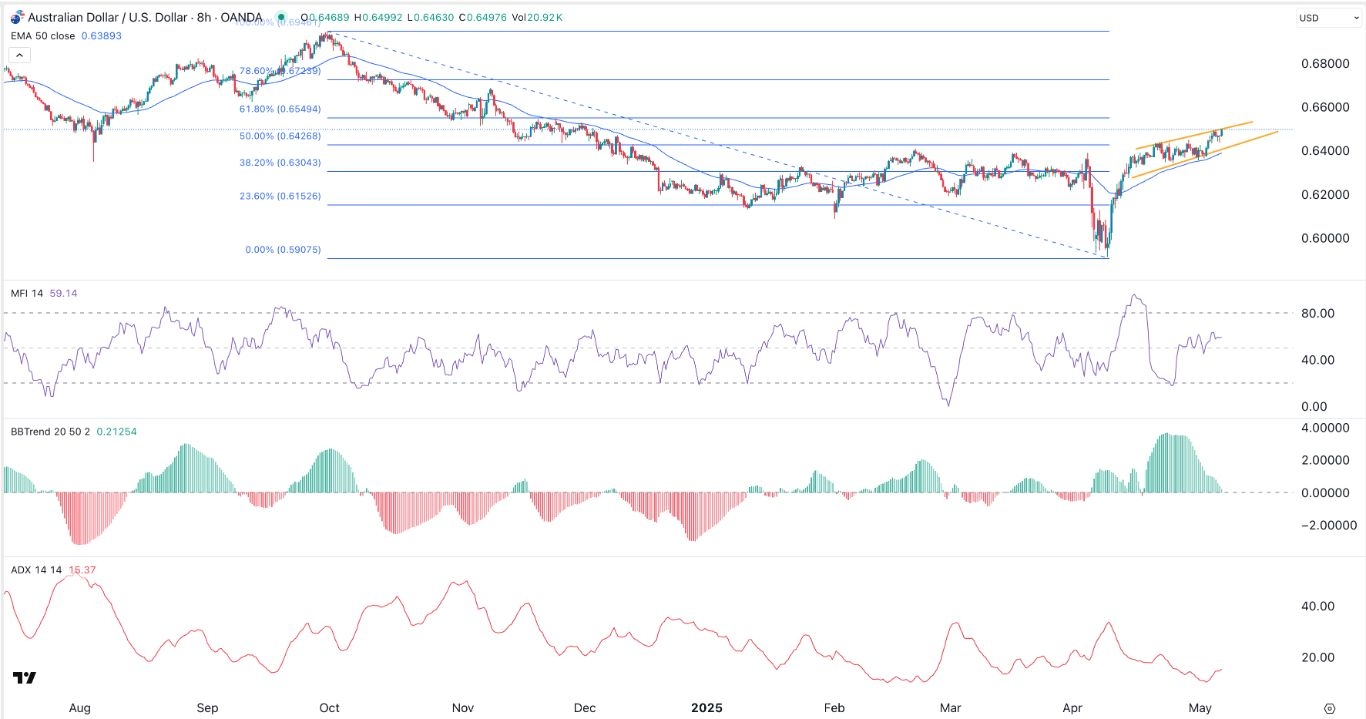
The AUD/USD exchange rate has been in a strong bullish trend in the past few weeks, moving from a low of 0.5907 in April to 0.6500, its highest level since December last year.
It has moved above the 50% Fibonacci Retracement level at 0.6425, and the 50-period Exponential Moving Average (EMA).
The pair’s Money Flow Index (MFI) has moved above the neutral level at 50, a bullish sign. However, the pair has formed a rising wedge chart pattern, which comprises of two ascending and converging trendlines.
The Average Directional Index (ADX) has moved below 15, a sign that the strength of this trend is fading. Also, the Awesome Oscillator has continued falling. Therefore, the pair will likely have a bearish breakdown, potentially to the support at 0.6300. A move above the 0.6550 will invalidate the bullish outlook.
Ready to trade our free trading signals? We’ve made a list of the top forex brokers in Australia for you to check out.
