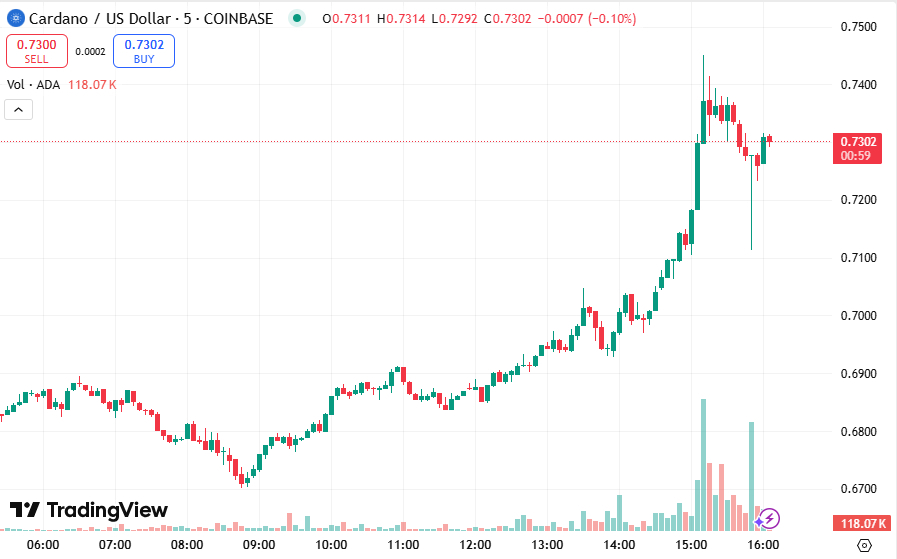
Investors are asking whether this new bullish breakout is a genuine trend reversal or a temporary bounce within a broader bearish structure.
After weeks of trading in a consolidation pattern, Cardano finally pierced through the upper resistance of a falling wedge, a typicallylly bullish reversal formation.
 Cardano Price Chart | Source: TradingView
The breakout occurred with a strong push above the $0.70 barrier, and ADA is now trading at approximately $0.735, up 5% on the day and 19% in the week.
Last Thursday’s price action ranged from a low of $0.672 to a high of $0.737, indicating strong intraday momentum. The volume accompanying the breakout has also seen a noticeable uptick, reinforcing the potential significance of the move.
ADA has now moved decisively above both its 50-day and 200-day Simple Moving Averages (SMAs). These long-term trend indicators turning bullish are a positive sign for ADA holders.
Historically, when a crypto asset reclaims these levels, it tends to trigger further buying interest from technical traders and institutions that rely on trend-following signals.
Currently, the 50-day SMA sits around $0.685, while the 200-day SMA is slightly lower at $0.663. With the price comfortably above both, the setup points to a momentum shift favoring bulls.
Another critical signal is the Relative Strength Index (RSI), which is currently at 66.2 on the daily chart. This level suggests strong buying momentum, but not yet an overbought condition.
As long as the RSI remains below the 70 threshold, ADA still has room to climb before attracting significant selling pressure from traders watching momentum metrics.
If Cardano can hold its current momentum, analysts are eyeing a series of upside targets based on historical breakout behavior and trend extension models.
The first major milestone lies around the $0.80–$0.82 range—a zone that could test how much conviction exists behind this rally. Should ADA push through with volume, attention may quickly shift toward the psychological $1.00 level, which hasn’t been seen since early 2023.
Beyond that, more ambitious traders are beginning to whisper about a possible return to the $1.10–$1.20 region, last visited before the market’s macro downtrend took hold.
In more optimistic scenarios, long-term projections suggest Cardano could revisit the $1.80–$2.60 range, which would signal a full recovery of 2021’s bull market highs.
Despite the bullish breakout, ADA does face near-term resistance. The $0.74–$0.75 zone is the first key area to clear with conviction. This region aligns with past horizontal support/resistance and could act as a temporary ceiling if profit-taking kicks in.
If ADA fails to hold above $0.70, a pullback toward $0.685 (the 50-day SMA) or even $0.66 (200-day SMA) remains a realistic scenario. Below that, the $0.62 zone serves as the next major support, where the bottom of the previous wedge pattern converged.
A breakdown below $0.60 would invalidate the bullish thesis and suggest a return to accumulation or even fresh lows, depending on broader market conditions.
Sentiment around ADA is currently improving, aided by broader optimism in the altcoin sector.
However, investors should remain cautious: macroeconomic uncertainties and Bitcoin dominance could still sway short-term price action. A sudden shift in Bitcoin’s trajectory could overshadow Cardano’s technical setup.
That said, Cardano has long been seen as a “slow builder” in the ecosystem, and its recent technical strength may reflect growing confidence in its roadmap, staking model, and smart contract ecosystem.
Ready to trade our daily Forex analysis on crypto? Here’s our list of the best MT4 crypto brokers worth reviewing.
