- EUR/JPY adds to the previous day’s strong move up amid a broadly weaker JPY.
- Japan’s disappointing macro data and a positive risk tone undermine the JPY.
- The technical setup favors bulls and backs the case for further appreciation.
The EUR/JPY cross attracts some follow-through buying for the second straight day on Friday and trades near the mid-164.00s heading into the European session. Spot prices remain close to over a three-week high touched on Thursday and remain well supported by a broadly weaker Japanese Yen (JPY).
The disappointing release of Household Spending data from Japan comes on top of a fall in Japan’s real wages for the fourth consecutive month and concerns that global trade tensions may weaken wage momentum. This is expected to complicate the Bank of Japan’s (BoJ) efforts to normalize monetary policy, which, along with trade optimism, undermines the safe-haven JPY and acts as a tailwind for the EUR/JPY cross.
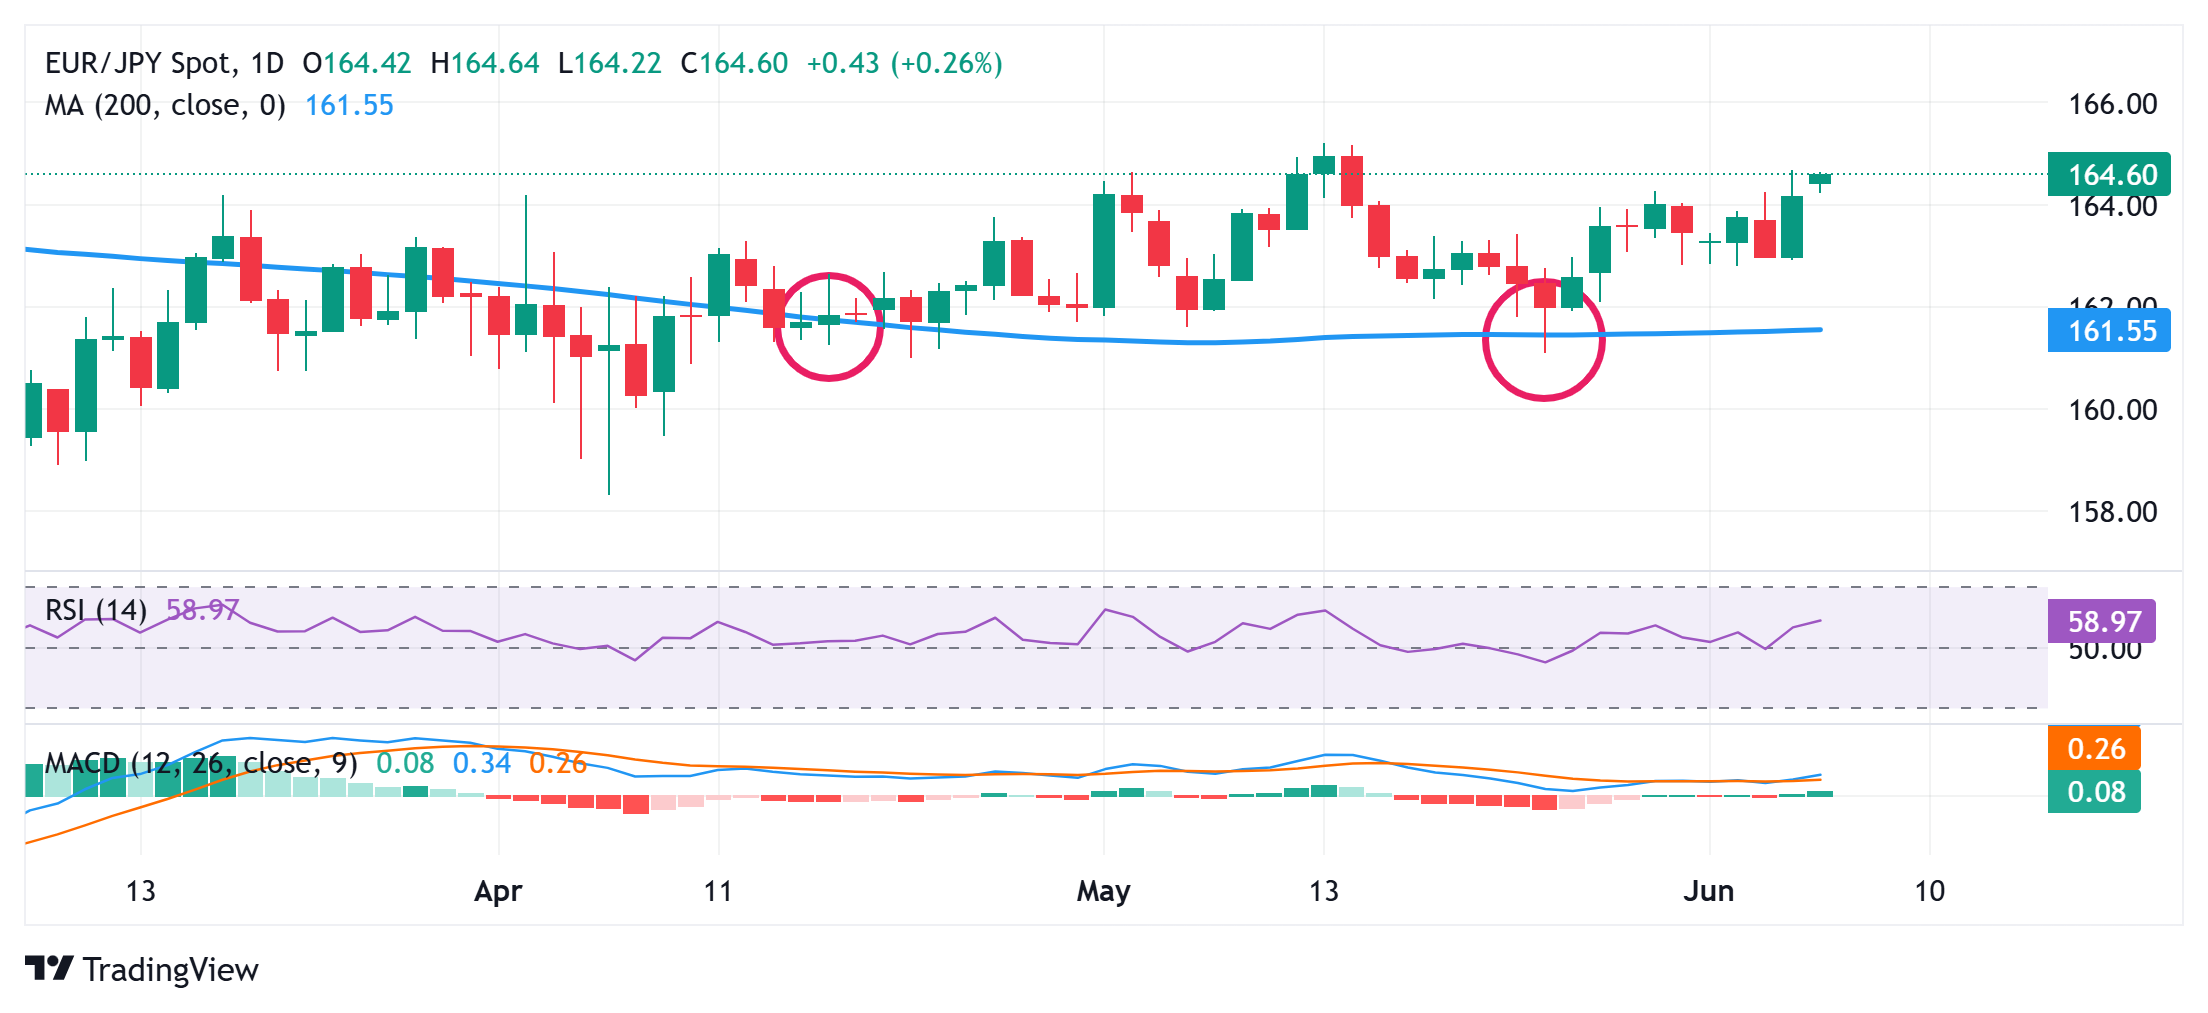
From a technical perspective, the recent repeated failures to find acceptance below the very important 200-day Simple Moving Average (SMA) and the subsequent move up favor bullish traders. Adding to this, oscillators on the daily chart are holding in positive territory and are still away from being in the overbought zone. This, in turn, suggests that the path of least resistance for the EUR/JPY cross is to the upside.
Hence, some follow-through strength towards the 165.00 round figure, en route to the 165.20 area or the year-to-date top touched in May, looks like a distinct possibility. The momentum might then lift the EUR/JPY cross the 165.60-165.65 intermediate hurdle before bulls eventually aim to reclaim the 166.00 mark for the first time since November 2024.
On the flip side, the daily swing low, around the 164.25-164.20 area could offer immediate support to the EUR/JPY cross ahead of the 164.00 round figure and the 163.70-163.65 region. Any further weakness could be seen as a buying opportunity and is more likely to remain limited near the 163.00 mark. The latter should act as a key pivotal point, which if broken might shift the near-term bias in favor of bearish traders.
EUR/JPY daily chart

Japanese Yen PRICE Today
The table below shows the percentage change of Japanese Yen (JPY) against listed major currencies today. Japanese Yen was the strongest against the Australian Dollar.
| USD | EUR | GBP | JPY | CAD | AUD | NZD | CHF | |
|---|---|---|---|---|---|---|---|---|
| USD | 0.12% | 0.16% | 0.33% | -0.07% | 0.19% | -0.09% | 0.21% | |
| EUR | -0.12% | 0.06% | 0.20% | -0.18% | 0.02% | -0.19% | 0.10% | |
| GBP | -0.16% | -0.06% | 0.12% | -0.23% | -0.03% | -0.25% | 0.04% | |
| JPY | -0.33% | -0.20% | -0.12% | -0.35% | -0.02% | -0.29% | -0.18% | |
| CAD | 0.07% | 0.18% | 0.23% | 0.35% | 0.25% | -0.01% | 0.27% | |
| AUD | -0.19% | -0.02% | 0.03% | 0.02% | -0.25% | -0.21% | 0.10% | |
| NZD | 0.09% | 0.19% | 0.25% | 0.29% | 0.00% | 0.21% | 0.28% | |
| CHF | -0.21% | -0.10% | -0.04% | 0.18% | -0.27% | -0.10% | -0.28% |
The heat map shows percentage changes of major currencies against each other. The base currency is picked from the left column, while the quote currency is picked from the top row. For example, if you pick the Japanese Yen from the left column and move along the horizontal line to the US Dollar, the percentage change displayed in the box will represent JPY (base)/USD (quote).

