- Short the WTI crude oil and set a take-profit at $55.40.
- Add a stop-loss at $67.
- Timeline: 1-2 days.
- Buy the WTI crude oil and set a take-profit at $67.
- Add a stop-loss at $55.40.
The WTI crude oil price rebounded last week as hopes of a trade deal between the US and China helped to offset the supply challenge facing the industry. It ended the week at $61, up from the weekly low of $55.40.

WTI crude oil price has been under pressure as it faces a double-whammy of higher supply and low demand. The demand factor is mostly because of the ongoing trade war that has pushed the IMF and the World Bank to slash the world economic forecast for the year. Oil demand often falls when the economy is not doing well.
The International Energy Agency (IEA) and the Energy Information Administration (EIA) have all slashed their oil demand forecast for the year, citing the trade war.
At the same time, prospects for higher oil production remain significantly high. For example, OPEC+ members committed to increasing production for the second consecutive month.
The US is also expected to continue boosting production this year, with the EIA expecting the supply to jump to 13.43 million barrels a day. Trump has insisted that US companies boost their production, which he hopes will help to lower inflation.
The US may also reach a deal with Iran and Russia this year, which will include sanctions relief, leading to higher oil production.
The next important catalyst for the WTI crude oil will be the outcome of the US-China talks. A sign that the two countries are progressing will likely lead to higher prices this week.
The other top catalysts will be the weekly US inventories data, which will provide more information about the state of the US oil market.
Also, oil will react to the US inflation data from the Bureau of Labor Statistics (BLS), which will provide more information about the impact of Donald Trump’s tariffs. Lower inflation figures may push the Fed to cut interest rates earlier than expected.
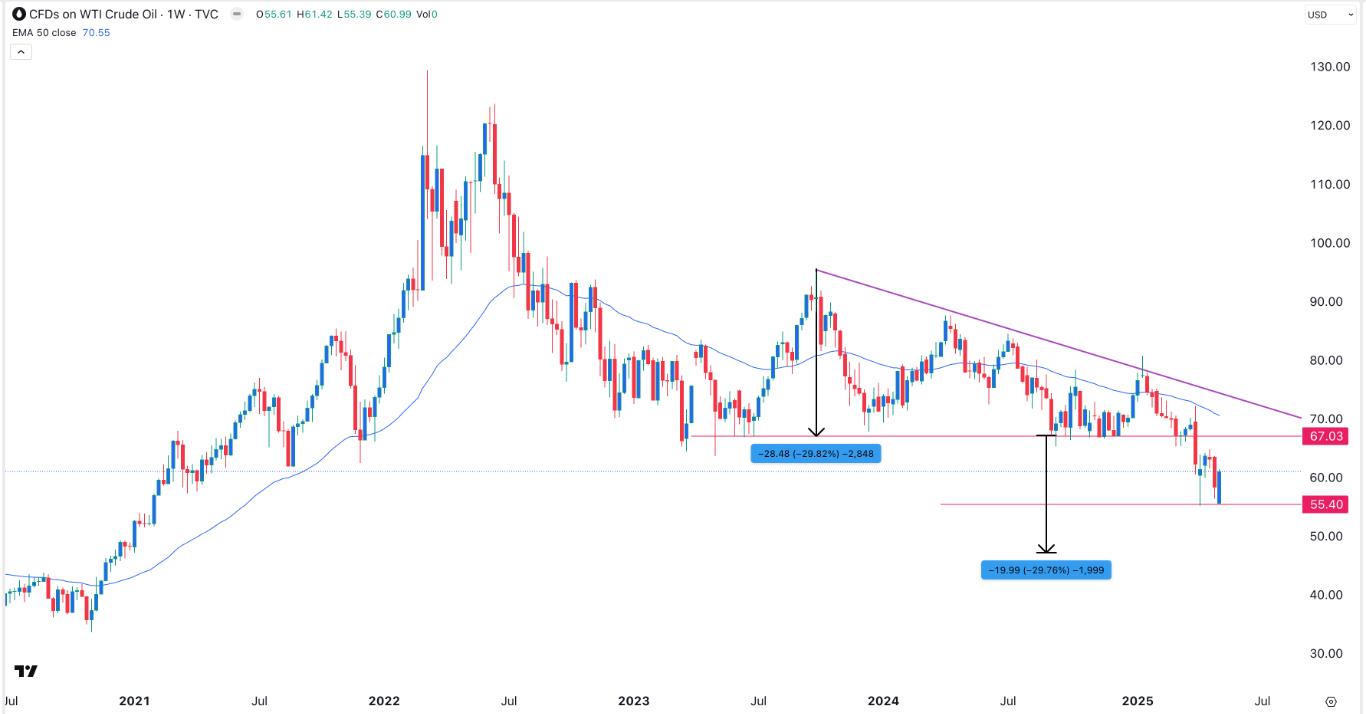
The weekly chart shows that the WTI crude oil price has been in a downtrend in the past few months. It dropped to a low of $55.40 last week and then bounced back to $61 amid optimism on trade.
WTI remains below the key support at $67, the lower side of the descending triangle pattern, a popular bearish continuation sign in technical analysis.
Measuring the distance between the highest point of the triangle and the lowest point shows that its widest point was about 30%. Measuring the same distance from the lower side of the triangle brings the next target to $46.
Therefore, the outlook for the WTI is bearish, with the initial target being last week’s low of $55.40. The alternative is where the price rises and retests the lower side of the triangle pattern at $67 and then resumes the downtrend.
Ready to trade our weekly forecast? We’ve shortlisted the best Forex Oil trading brokers in the industry for you.
