The ongoing crypto pullback saw Bitcoin (BTC) drop 11% to as low as $74,400, with more than $1.2 billion liquidated in the derivatives market.
Brief Crypto Pump from Fake Tariff News
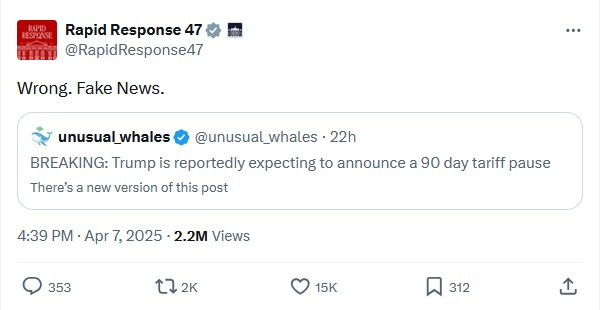
However, crypto prices momentarily rallied after rumors began circulating on X that US President Donald Trump was considering a 90-day pause on tariffs. Bitcoin price rallied to $81,180 within minutes, with Ether (ETH) rising back above $1,600.
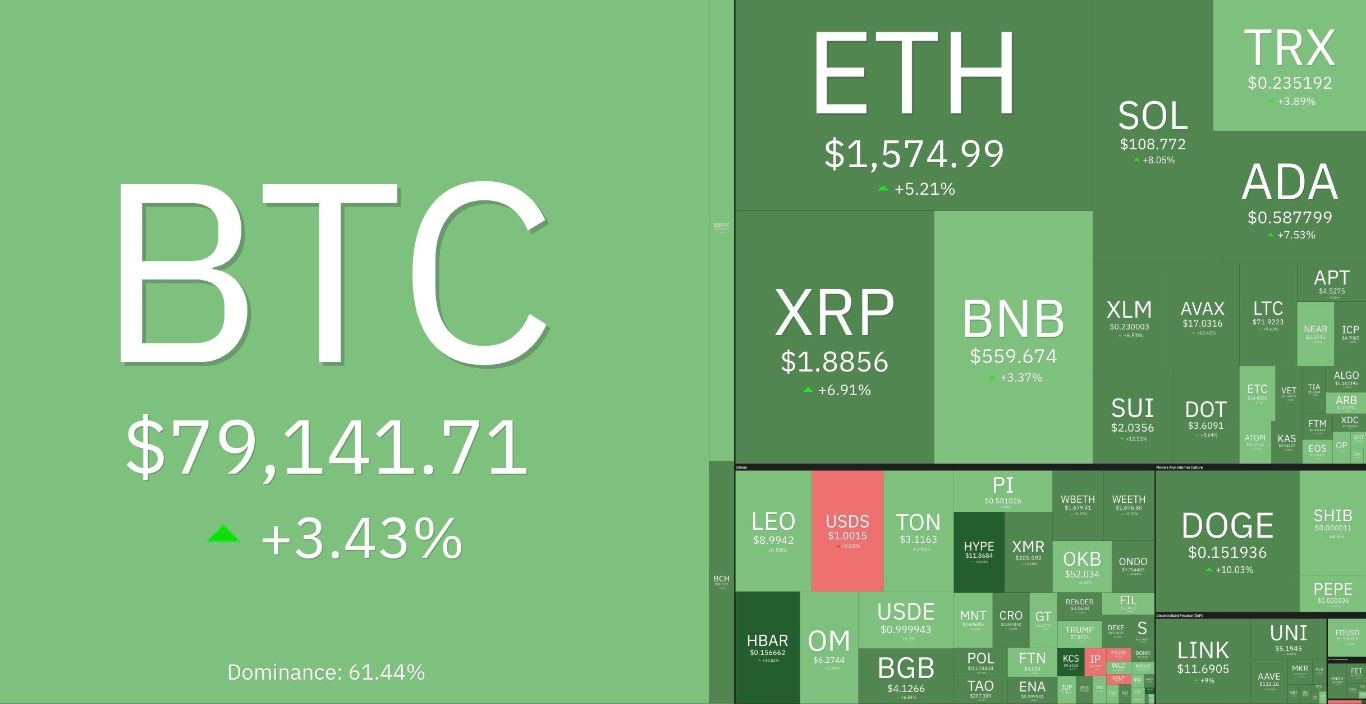
Other top-cap cryptocurrencies such as Solana (SOL), Ripple’s XRP, BNB Chain’s BNB and the leading memecoin Dogecoin (DOGE) also witnessed significant rallies, rising above key levels.
The rallies were, however, stopped in their tracks after the White House confirmed that the rumor was not true.

The crypto market has been in positive territory for the last 24 hours. Still, despite this uptick, the sustainability of the recovery remains uncertain as bearish undercurrents remain the same as before the tariff-pause rumor started to circulate.

24-hour performance of top-cap cryptocurrencies. Source: Coin360
The Fear and Greed index has fallen below levels last seen at the beginning of the 2022 bear market. The latest data from the Index, which uses a basket of factors to analyze “sentiment and emotions” around cryptocurrencies, gives a reading of just 4/100. This is even lower than levels seen during the COVID-19 market crash and FTX collapse.

Fear & Greed Index. Source: CNN
Bitcoin Price Must Reclaim $80K to Prevent Further Fall
Bitcoin is at risk of falling below its previous all-time high of $73,800, reached on March 14, 2024, if a key support level is not reclaimed.
After dropping below $75,000 for the first time since November 2024, BTC is rapidly reactivating long-forgotten bull market support lines.
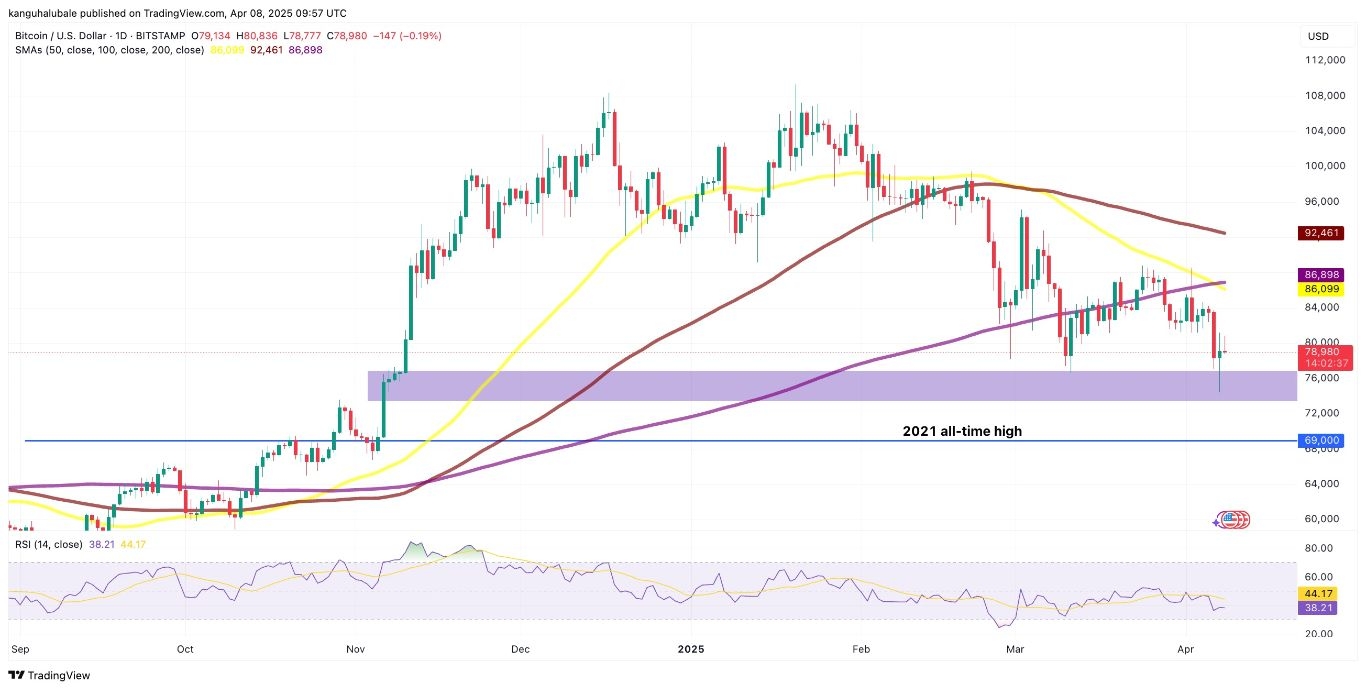
These include the fair gap value between $73,300 and $77,000 as well as the $69,000 level, representing the all-time high from the 2021 bull cycle.

BTC/USD daily chart. Source: TradingView
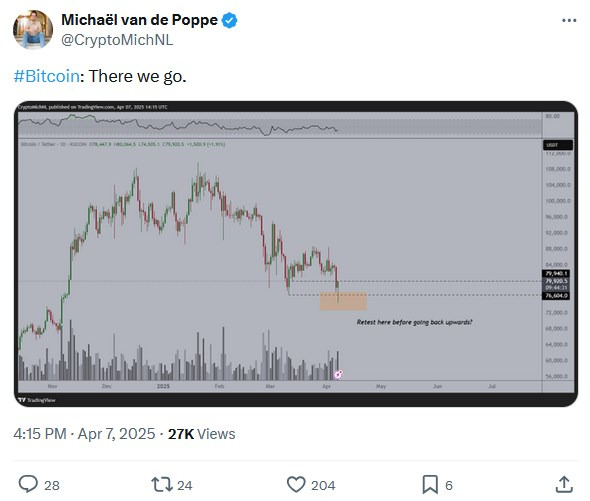
MN Capital founder Michael van de Poppe said that it is necessary for Bitcoin to revisit the $73,300 and $77,000 demand zone before bouncing back.

Also adding to the bearish sentiment is the appearance of a “death cross” in the daily timeframe. This typical bearish signal involves the 50-day simple moving average (SMA) crossing below its 200-day SMA, as shown in the chart above.
The momentum carrying through that death cross puts Bitcoin at a critical macro support test, as described by van de Poppe.
Among the levels that bulls are currently focusing on is the psychological level of $80,000, which must be reclaimed to abate further losses.
A clear and decisive close above this level would see the price first toward the resistance at $84,000 and later toward the $86,000 and $87,000 zone, where the 50-day and 200-day simple moving averages (SMAs) appear to converge.
Other levels to watch on the upside are the $90,000 psychological level and the 100-day SMA at $92,461.
