The ongoing Bitcoin rally hit a snag with the largest cryptocurrency by market capitalization dropped by as much as 5.7% to an intraday low of $116,300 on July 15th. The price is currently facing rejection from the $120,000 psychological level, which is the highest daily-candle close in history.
Bitcoin Price Likely to See Volatility After CPI Reading
The Consumer Price Index (CPI) is a key economic indicator that measures inflation through changes in consumer goods and services prices.
The CPI’s impact on Bitcoin stems from its influence on monetary policy expectations, particularly regarding the US Federal Reserve’s interest rate decisions. A higher-than-expected CPI reading, projected at around 2.6% year-over-year or 0.3% month-over-month, could signal persistent inflation, reducing the likelihood of rate cuts and strengthening the US dollar. This typically pressures risk assets like Bitcoin, as investors shift toward safer investments.
Conversely, a softer-than-expected CPI could weaken the dollar, boosting risk-on sentiment and potentially driving Bitcoin prices higher. It could revive the bullish momentum and push BTC beyond $120,000 again. A similar outcome occurred in May, when cooler CPI triggered a sharp rally.
“CPI Data 1 hour from now. It is expected to be higher than last month due to an increase in OIL price and such,” said popular analyst Daan Crypto Trades in a July 15 post on X, adding:
“The big question is if it goes even higher than the expectations. The recent comment by Bessent seems kinda like foreshadowing and bracing for a higher number. This could stir things up a bit, and $DXY already seems to be moving a bit.”

CPI Print Expectations. Source: Daan Crypto Trades
The $120,000 level has emerged as a pivotal psychological and technical threshold, with market participants closely monitoring whether BTC reclaims this mark post-CPI release.
Institutional Demand to Drive Bitcoin Price Higher
Bitcoin’s price movement is not solely driven by CPI data but also by broader economic and institutional factors. The recent US-China trade agreement, which de-escalated tariff tensions, initially boosted risk assets like BTC, contributing to its rally past $120,000.
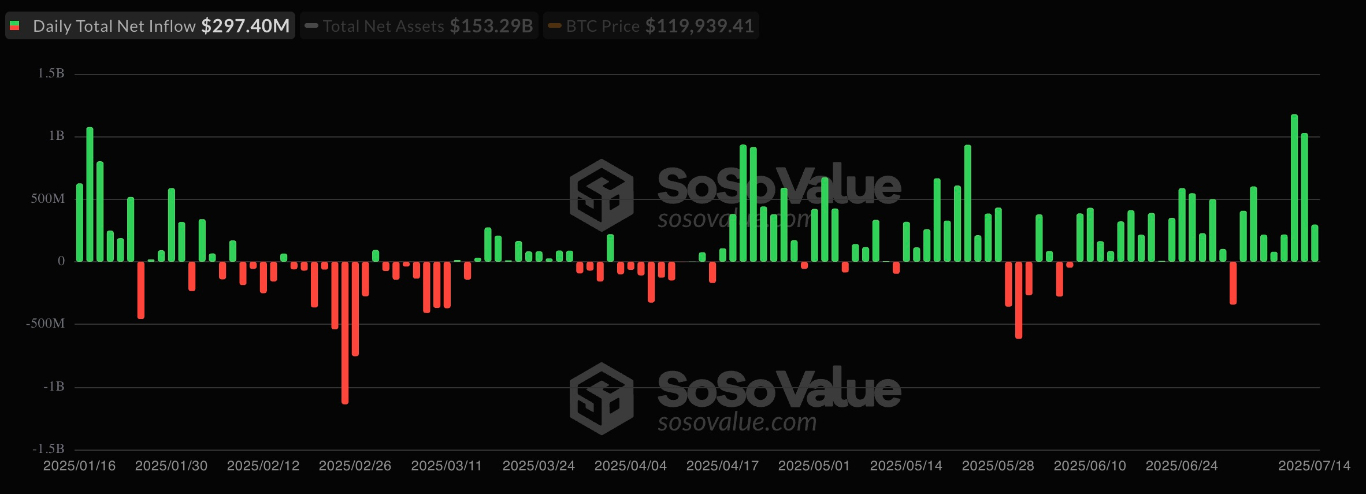
However, concerns about Trump’s “Liberation Day” tariffs and their potential to reignite inflation have kept markets on edge. Institutional interest remains a significant driver, with US-based Bitcoin spot exchange-traded funds (ETFs) recording net inflows in the last 23 out of 24 days, as per data from SoSoValue. Inflows into these investment products totaled $2.7 billion during the week ending July 11.

Spot Bitcoin ETF Flows. Source: SoSoValue
Moreover, $2.7 billion flowed into global Bitcoin investment products last week, according to data from CoinShares.
Companies like MicroStrategy, the largest corporate BTC holder, and Metaplanet continue to bolster market confidence, with forecasts suggesting Bitcoin could reach $155,000 by year-end if institutional buying persists.
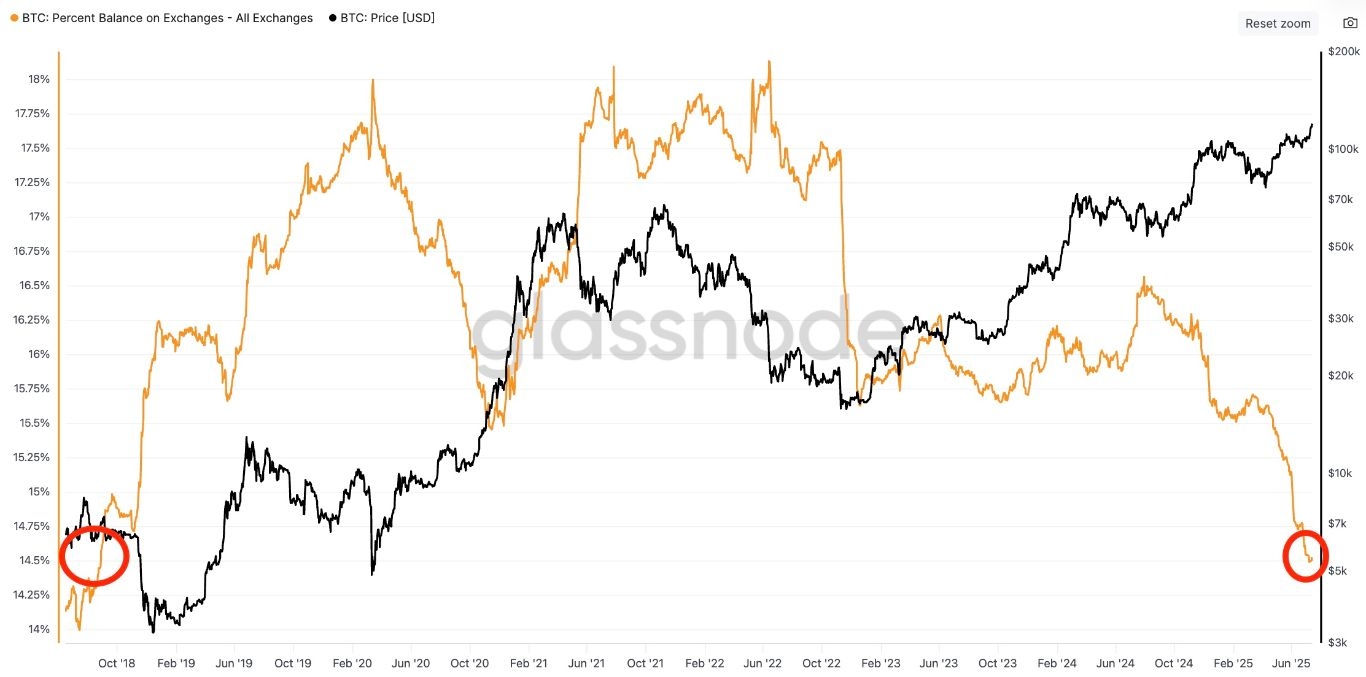
Bitcoin percent supply on exchanges has dropped to near seven-year lows, falling to 14.5% for the first time since August 2018, Glassnode data shows.

Bitcoin Supply Chart. Source: Glassnode
Diminishing Bitcoin supply on exchanges may signal an incoming price rally fueled by a “supply shock,” which occurs when strong buyer demand meets decreasing available BTC
This trend usually signals rising investor confidence and a shift toward long-term holding. For example, BTC is typically transferred to cold storage or self-custody wallets, reducing the liquid supply available for trading.
Bitcoin Traders Focus on $120K and Beyond
The interplay of these factors—CPI-driven volatility, technical resistance, and institutional support—positions $120,000 as a critical level for Bitcoin’s near-term trajectory.
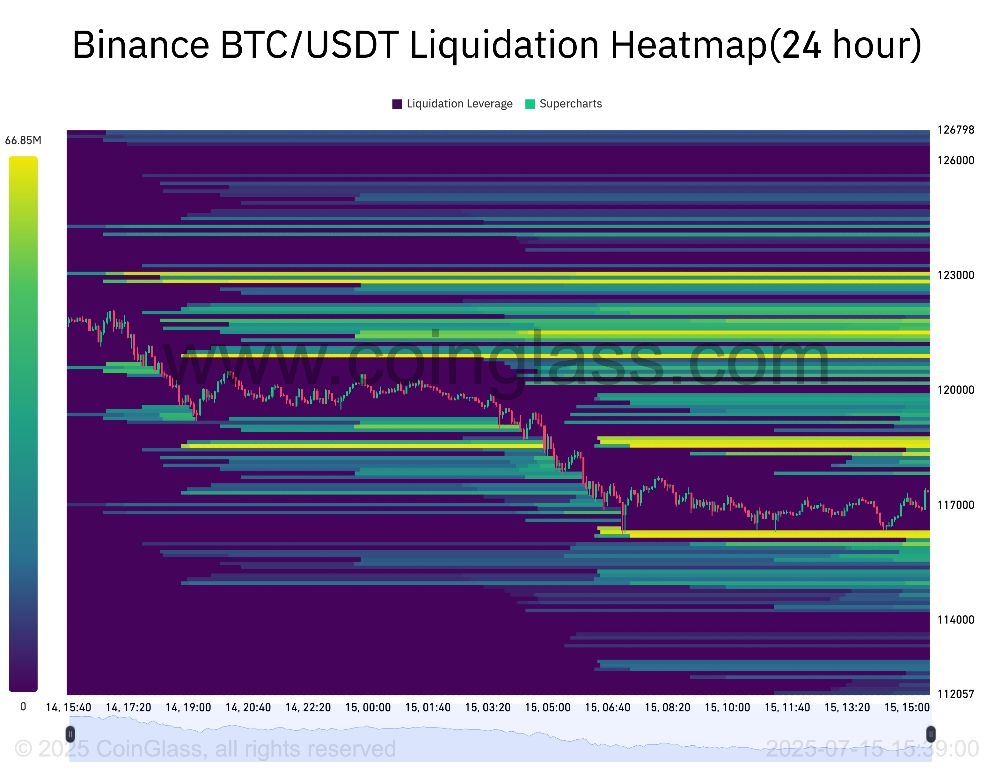
With BTC price action retreating, however, liquidity on either side of the spot price is growing, and this usually results in a snap move to neutralize it, an event often called a liquidity “grab.”
It wouldn’t be a surprise to see BTC price push a little higher into the $126,000 area before pulling back and taking the liquidity below $116,000 with a quick wick.

BTC 24-Hour Liquidation Heatmap. Source: CoinGlass
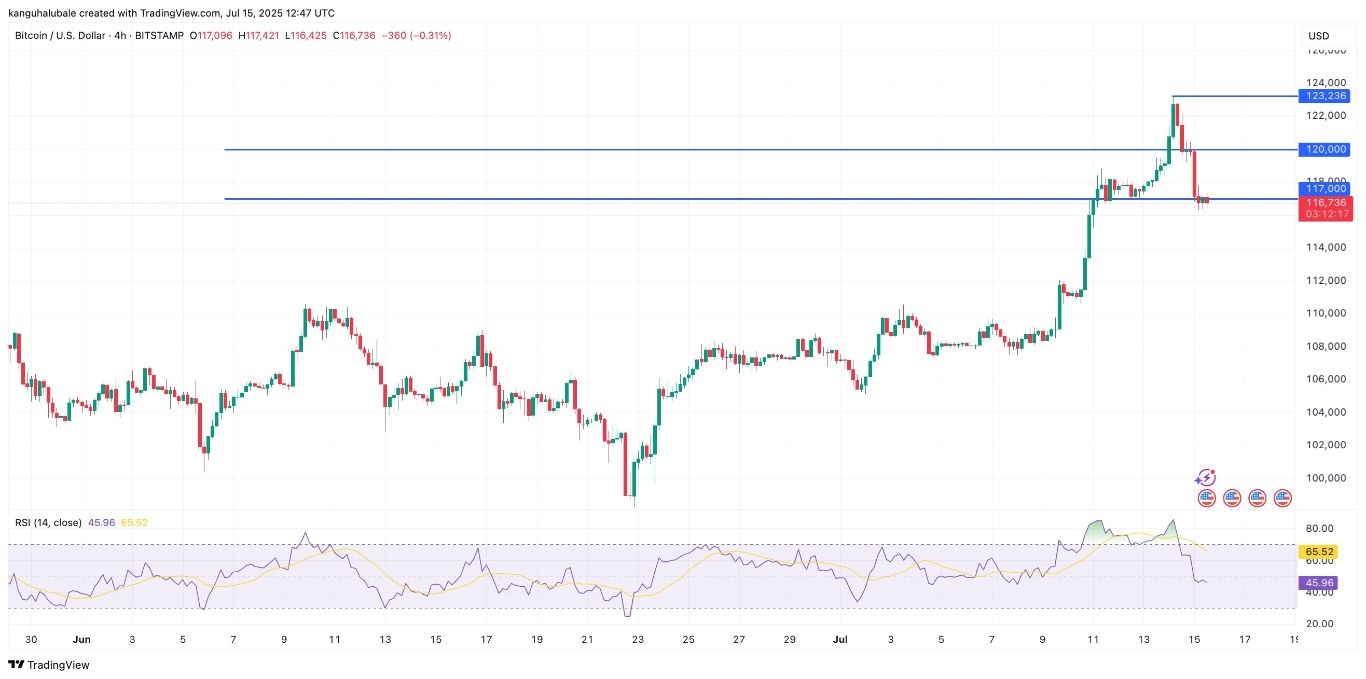
From a technical perspective, Bitcoin price needs to reclaim $117,000 and overcome resistance at $120,000 to secure the rally. Higher than that, the next logical would be a breach of the all-time highs at $123,000, ushering Bitcoin into price discovery.

BTC/USD 4-Hour Chart. Source: Cointelegraph / TradingView
The RSI has dropped from overbought conditions at 85 on Monday to 46 at the time of writing, indicating increasing downward momentum.
As such, BTC could drop from the current levels to fill the CME gap between $115,500 and $114,00.
Ready to trade our Bitcoin forecast? Here’s our list of the best MT4 crypto brokers worth checking out.
